Couple follow-up charts to this, as I continue to dig through the data. (I'm still working through all this, so no big conclusions/takeaways here -- mostly just datapoints and a few observations.)
First, the surge in job-switching is heavily concentrated among younger workers. Among older workers, switching is still below prepandemic levels. Among prime-age (25-54), it's above, but not by that much. But job-to-job transitions are WAY up for workers under 25.
Before you start complaining about "job-hopping Gen-Zers," though, note that: a) job turnover is *always* highest among younger workers, and b) young workers, prepandemic, were changing jobs *less* often than prior generations.
cc @graykimbrough
If we cut job turnover by occupation, we see a similar pattern to the educational chart I tweeted yesterday, but a bit less dramatic. The surge in job-switching is concentrated among front-line workers. It's up among office workers too, but not by nearly as much.
Note that I'm collapsing already-broad occupational categories ("sales" for example includes both cashiers and real estate brokers) into even broader groupings. So that may be obscuring larger differences beneath the surface.
The CPS sample size really isn't big enough to drill down on specific occupations/industries, at least on a monthly basis. But we can see in JOLTS that there was a big spike in quits in accommodation and food service in September.
Turning back to CPS, and aggregating across three months to beef up our sample, we can see the shift clearly, but it's not that dramatic -- even in this high-turnover industry, most workers stay in their jobs each month.
But CPS can help answer the "where are they going?" question. We aren't seeing a wave of people hopping between restaurant jobs looking for better pay. Nor are we seeing people ditching the industry for greener pastures. The big increase has been people leaving work entirely.
Same story if we focus on front-line food-service workers (coded by occupation rather than by industry): Significant but modest increase in turnover, with most of the action in people leaving work, not taking new jobs.
Some caveats here: These charts include involuntary exits, not just quits (though layoffs are low right now). We also can't tell if people have other jobs lined up and are just taking some time off in between.
These numbers are also just generally noisy, so approach with caution.
Taken at face value, though, these numbers seem consistent with anecdotes of service workers quitting jobs out of frustration with working conditions (maybe including Covid safety). Perhaps aided by savings and the knowledge they can get another job when they need one. \fin

• • •

Missing some Tweet in this thread? You can try to force a refresh
 

Keep Current with Ben Casselman

Ben Casselman Profile picture

Stay in touch and get notified when new unrolls are available from this author!

Read all threads

This Thread may be Removed Anytime!

PDF

Twitter may remove this content at anytime! Save it as PDF for later use!

Try unrolling a thread yourself!

how to unroll video
  1. Follow @ThreadReaderApp to mention us!

  2. From a Twitter thread mention us with a keyword "unroll"
@threadreaderapp unroll

Practice here first or read more on our help page!

More from @bencasselman

22 Oct
Lots of new state labor market data today!
State and local employment/unemployment: bls.gov/news.release/j…
State-level JOLTS (new report!!!): https://t.co/0WlgRWt5uC
I'm busy with other stories today, so won't be delving into the numbers in depth, at least right away. But a few charts to update my earlier reporting on the impact of cutting off UI benefits.
nytimes.com/2021/08/20/bus…
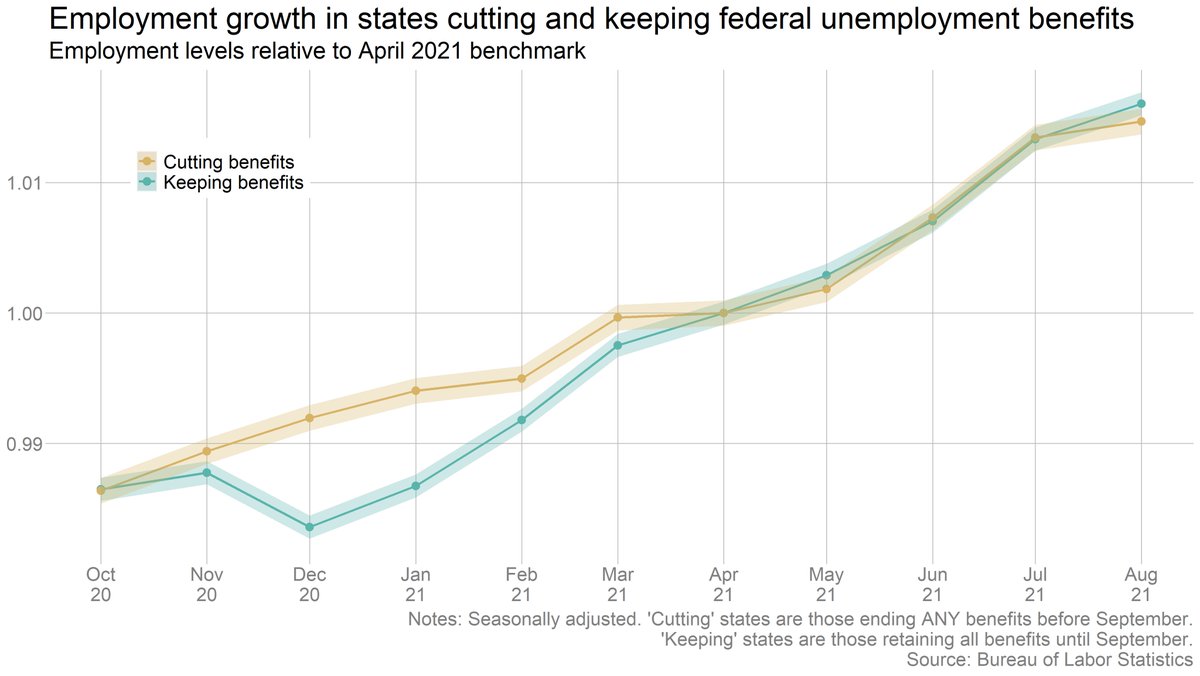
The short version: Still no evidence that states that cut off benefits early have seen significantly faster job growth than states that kept the benefits. The two groups have seen essentially identical job growth since April. Image
Read 10 tweets
19 Oct
Fall was meant to mark the beginning of the end of the labor shortage that has held back the economic recovery. Instead, the labor force *shrank* in September. What happened?
Thread below, story here:
nytimes.com/2021/10/19/bus…
Last spring, many people blamed extra unemployment benefits for keeping people out of work. Some GOP politicians continue to make that claim. But the evidence doesn't support it: Data from states that ended benefits early shows that any impact was small.
nytimes.com/2021/08/20/bus…
Many progressives have argued there is a "shortage of wages, not of workers." But pay has been rising rapidly, especially in lower-wage industries, and the hiring difficulties aren't limited to low-wage sectors.
Read 20 tweets
12 Oct
There were 10.4 million job openings at the end of August -- down from July, but still near a record high. #JOLTS
Hiring also fell, and unlike openings has been slow to rebound over all -- only modestly above prepandemic levels.
The number of unemployed workers per job opening ticked up ever so slightly in August, but there are still more jobs than available workers.
(Note: This chart adjusts for workers misclassified as "employed.")
Read 8 tweets
17 Sep
Did states that cut off expanded unemployment benefits early see a surge in job growth? We just got August data from @BLS_gov, and the answer still appears to be "no."
A thread updating this story: nytimes.com/2021/08/20/bus…
States that kept expanded unemployment benefits actually saw slightly *faster* job growth in August than states that ended all pandemic programs, though the difference was not statistically significant. Image
We see the same basic pattern if we instead compare states that kept benefits to those that cut off ANY benefits (i.e. including those that cut the $300 add-on but kept PUA/PEUC). Image
Read 12 tweets
20 Aug
Going to do a quick thread with a first look at what new state-level July data tells us about the impact of cutting UI benefits.
Context:
Key caveat here: The state-level data is noisy, and there are a LOT of differences between these states, both in general and in how they've responded to the pandemic in particular. So it's not easy to design a clean experiment here.
That said: It sure doesn't look like there's been a big jump in employment in the states that cut benefits so far. A few charts:
Read 14 tweets
9 Aug
Job openings hit a new record in June, but crucially, hires *also* rose. Suggests employers are finding a way through the labor logjam. #JOLTS
bls.gov/news.release/e…
Different story in leisure and hospitality, however, where openings were up again but hiring was flat (though still high by historical standard, consistent with what we saw in the monthly jobs reports).
It's a good time to be looking for a job (and a hard time to be trying to hire): There was just under 1 unemployed worker for every job opening in June. (Note that this adjusts for workers misclassified as "employed," though not for people who have left the labor force.)
Read 5 tweets

Did Thread Reader help you today?

Support us! We are indie developers!


This site is made by just two indie developers on a laptop doing marketing, support and development! Read more about the story.

Become a Premium Member ($3/month or $30/year) and get exclusive features!

Become Premium

Too expensive? Make a small donation by buying us coffee ($5) or help with server cost ($10)

Donate via Paypal Become our Patreon

Thank you for your support!

Follow Us on Twitter!

:(