The 7-day rolling rates for 10-14s in the South West continue to rise alarmingly. In Cheltenham the rate has now reached 6900/100k (for comparison, Kettering, which previously had the highest ever rate for this age group, peaked at 6304/100k). Here's the graph since 1 September. Image
And for context, if we zoom out over the last year, the graph looks like this. I guess it's a relief that the half-term break is here, but I hope the holidays won't involve lots of socialising with extended family ... Image
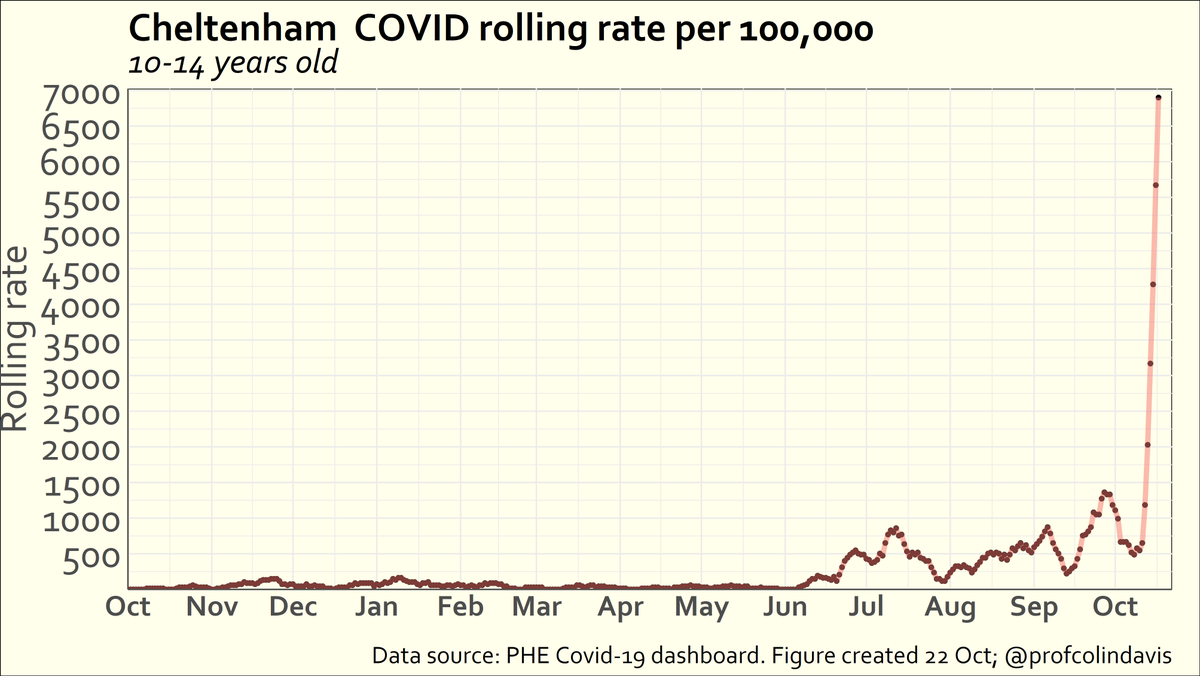
In case you're wondering, having overtaken Kettering, Cheltenham moves into third place in the highest rolling rates in any year group. Second place is held by Nottingham 15-19 year olds (more specifically, 18 year olds in university halls at the start of term last year). Image
I suspect Cheltenham will overtake Nottingham soon. But half-term means it probably won't be able to take the top spot, currently occupied by Newcastle 15-19s (another freshers week fiasco). The rate there reached 8137/100k. Hard to beat, perhaps, but DfE won't give up easily. Image
Cheltenham's 10-14 year olds have moved past Nottingham's 15-19s into 2nd highest age-specific rolling rate we've ever seen in England. And at 7714 per 100k (1 in 13 tested positive last week), it's looking like maybe they'll make it to the #1 spot in the next day or two. Image

• • •

Missing some Tweet in this thread? You can try to force a refresh
 

Keep Current with Colin Davis

Colin Davis Profile picture

Stay in touch and get notified when new unrolls are available from this author!

Read all threads

This Thread may be Removed Anytime!

PDF

Twitter may remove this content at anytime! Save it as PDF for later use!

Try unrolling a thread yourself!

how to unroll video
  1. Follow @ThreadReaderApp to mention us!

  2. From a Twitter thread mention us with a keyword "unroll"
@threadreaderapp unroll

Practice here first or read more on our help page!

More from @ProfColinDavis

24 Oct
THREAD. Encouraged by @fascinatorfun, I've been taking a look at NHS Test & Trace data on void PCR results, hoping this might shed light on how different regions have been affected by the #Immensa lab failure. TL;DR there is a problem affecting labs, but not just for the SW.
If you’ve taken a PCR test, it’s possible (though not likely) that you’ll have had one of these - a void result. It means that the lab wasn’t able to read the sample, or some other problem prevented a definitive result (so you need to do another test). nhs.uk/conditions/cor…
@fascinatorfun noted that voids “often give a clue as to whether there are equipment issues, training needs or overstretched capacity resulting in people rushing and taking short cuts”. And as @OliasDave has shown, the void data are weird.
Read 18 tweets
19 Oct
Now that Covid samples from the South West are being sent to a different lab, rolling rates are undergoing a rather dramatic adjustment. Here's a thread 🧵illustrating that, focusing on the rates for 10-14 year olds.
As a reminder, samples from the South West were being sent to a lab that (for reasons that have not yet been explained) was producing a high rate of false negatives.
This thread from yesterday noted that it was already apparent in September that something was fishy.
Read 10 tweets
18 Oct
The case numbers for the South West of England had quite a few of us scratching our heads in September ... 🧵
I only just made that last graph now, and you might say it's easy to see in hindsight, but here's @OliasDave plotting the data a month ago (and already then, "Still convinced there is something odd going on").
This graph, also from @OliasDave in September, is a particularly nice way of visualising how weird the results for the South West were relative to the rest of the country.
Read 12 tweets
16 Oct
I've focused on Wellingborough and Trafford previously, so let's take a look at Ipswich, which has the third highest rolling rate in the UK.
In the recent spike, cases initially took off around September 15th, among 10-14s (following a pattern seen all around the country). The increase among 15-19s was less steep, presumably reflecting the fact that many in the latter group are vaccinated.
A week later, around September 22, we start to see cases taking off among those in their 40s. "Parents!", you say. I couldn't possibly comment.
Read 5 tweets
15 Oct
Today marks a milestone of sorts: the number of children under 14 who've tested positive for Covid in England just passed one million (1,003,787 to be precise). 🧵
This number underestimates the number of infections, of course, because a) there wasn't really any testing of children in the first wave (the graph shouldn't be flat prior to Oct 2020), and b) many children (especially younger children) are asymptomatic when infected.
And the figure doesn't include all children (15-17 year olds are in the same age band as 18 and 19 year olds, so it's hard to cleanly separate children and young adults).
Read 10 tweets
9 Oct
An argument I've been trying to make for a long time is that mass infection of children is not only bad for children, but also bad for adults, because rates in children affect rates in adults (because that's how infectious diseases work). Here's another way of looking at that.🧵
This plot answers the following questions:

a) if I know Covid rates in school-age children (5-9s & 10-14s), how accurately can I predict rates in adults?

b) which adult age bands will I be able to predict most accurately?

[SPOILER: There aren't going to be any surprises here]
The data set covers the entire pandemic to date in England (30 Jan 20 - 3 Oct 21). The y-axis measures how well we can predict rates for a given adult age group on a given day if we know the rates for 5-14 year olds from 2 days earlier. (A value of 1 would be perfect prediction).
Read 9 tweets

Did Thread Reader help you today?

Support us! We are indie developers!


This site is made by just two indie developers on a laptop doing marketing, support and development! Read more about the story.

Become a Premium Member ($3/month or $30/year) and get exclusive features!

Become Premium

Too expensive? Make a small donation by buying us coffee ($5) or help with server cost ($10)

Donate via Paypal Become our Patreon

Thank you for your support!

Follow Us on Twitter!

:(