The 90 degree angle inflection point in a stock is a signal to book profit
Lets understand with a recent example of a stock #IRCTC 🚃🚋
Time for a thread🧵
Lets understand with a recent example of a stock #IRCTC 🚃🚋
Time for a thread🧵
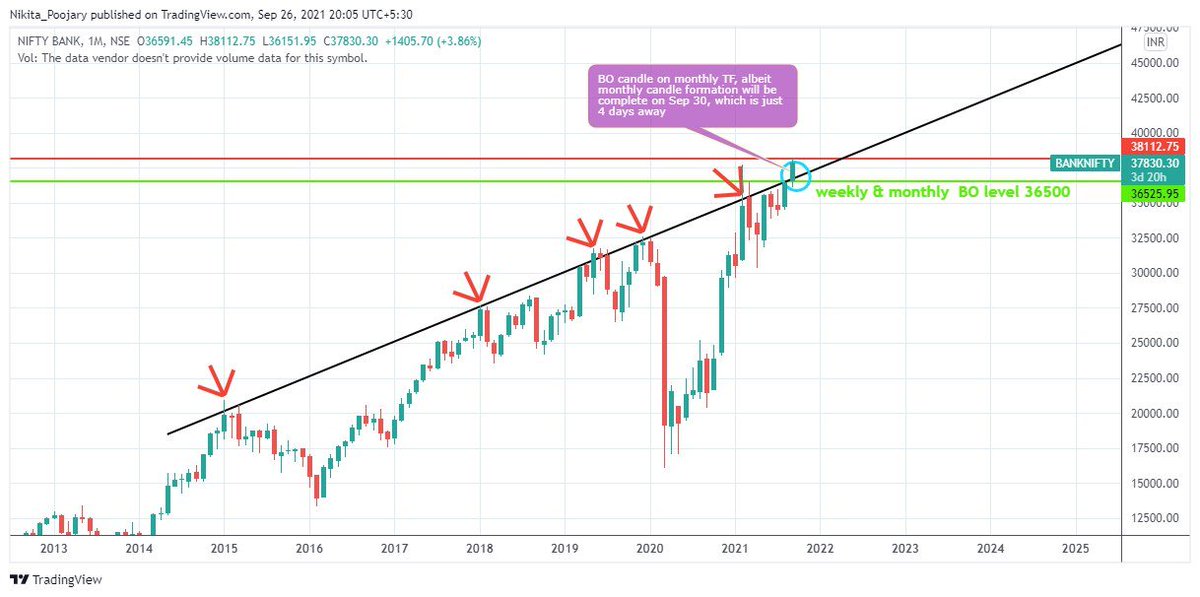
Monthly TF:
Back to back 6 green candles (each candle represent a month here), which means no profit booking has happened on a larger TF
The angle towards the end of the upmove became much steeper i.e. 90 degree
Such moves are highly susceptible for a bend in the trend
Back to back 6 green candles (each candle represent a month here), which means no profit booking has happened on a larger TF
The angle towards the end of the upmove became much steeper i.e. 90 degree
Such moves are highly susceptible for a bend in the trend

Similar pattern was observed in BTC/USDT pair #BITCOIN
and then BTC fell ~50% from its high made in the month of March 2021
and then BTC fell ~50% from its high made in the month of March 2021

No trend will exceed 90 degrees on a stock chart
The result of the extreme Angle of Ascent is a early warning signal 🚩
The stock is at risk of profit taking that may turn into a slide downward
The result of the extreme Angle of Ascent is a early warning signal 🚩
The stock is at risk of profit taking that may turn into a slide downward
Weekly TF #IRCTC
The current weeks candle is a huge price candle in the entire chart history of the stock along with highest volume bar
This clearly indicates the trend has clearly changed for the stock
The current weeks candle is a huge price candle in the entire chart history of the stock along with highest volume bar
This clearly indicates the trend has clearly changed for the stock

Folks who are looking to buy this stock, remember that after the strong upmove the stock will witness some more negative action.
Also just like BTC this stock too may witness some sideways dull action before the changing its trend to bullish again
Also just like BTC this stock too may witness some sideways dull action before the changing its trend to bullish again
These targets are not meant for shorting but to look for some bullish signs around these levels for folks who are waiting to jump on this wagon🚋

Hope you enjoyed reading this thread! 🧵
Will be posting more such curiosity-inducing threads 🤠
Will be posting more such curiosity-inducing threads 🤠
• • •
Missing some Tweet in this thread? You can try to
force a refresh