
Complete analysis of the SL20
#stocks #SriLanka
Good breakout and pulled back to support, so far 2 days into the week and prices have almost recovered last week's losses
Approaching strong resistance at 3670
And then again around 3880 - Trend remains very bullish
#stocks #SriLanka
Good breakout and pulled back to support, so far 2 days into the week and prices have almost recovered last week's losses
Approaching strong resistance at 3670
And then again around 3880 - Trend remains very bullish

#BRWN - Only company out of the LOLC group that has pushed above ATHs. Excellent breakout today and with BIL on the move, this is heavily correlated to it and likely to move alongside BIL

#COMB - Ascending triangle, however yet to breakout and give a confirmation signal. Looks good, if a successful breakout, prices point towards retesting Jan highs and above

#DIPD - Massive volume near support, however alot of work left to be done here to consider shifting to the buying side for me. Looking for that 56 break for a possible signal that momentum is shifting to the buying side - Earnings is key!

#DIAL - A LT pick IMO, massive massive resistance around 14.80 with another resistance from the trendline which has stalled prices for 3 years. A breakout above the trendline might signal a trend reversal and an early signal thst 14.80 might get broken

#EXPO - A continuation gap on the chart so far, as long as prices remain above the lower end of the gap, it will not be an exhaustion gap. Low selling pressure and above 230, 240 is the likely target

#HAYL - Impulse move above the handle and then had a strong consolidation. My flag pattern predicts a target of around 145 and heavy volume on the buying side was seen today. Key level to break is 110

#HNB - A massive descending broadening wedge on the weekly chart. Another good pick for the LT and prices are trending. Strong resistance up ahead. I expect SL20 to reach new highs which would mean most these stocks would do so as well

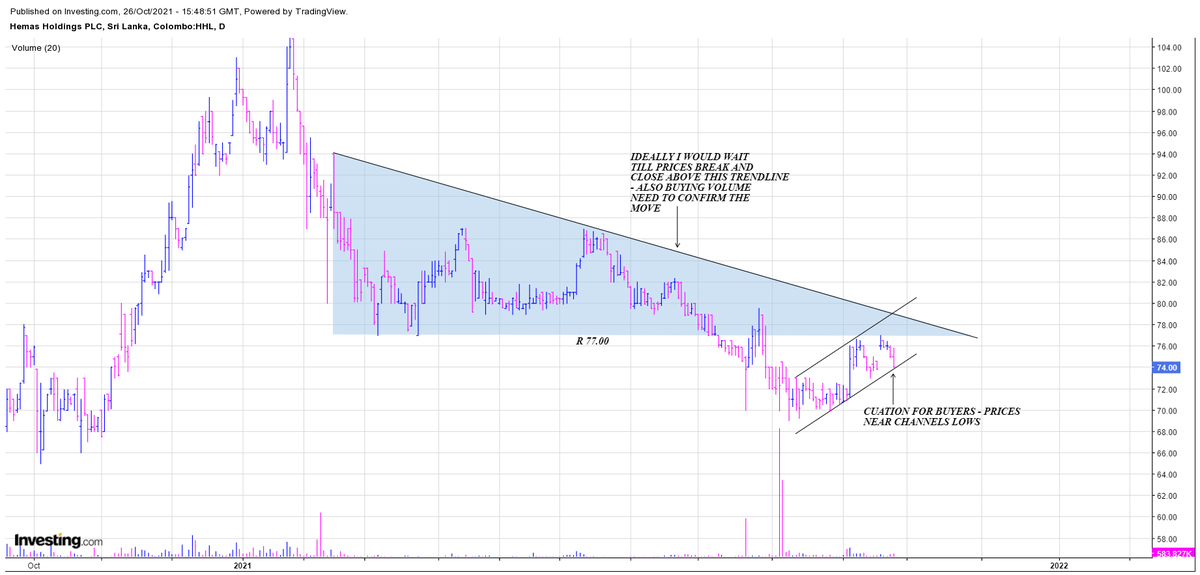
#HHL - Bearish break below the descending triangle. So far prices trading inside a rising channel and as a trader I would look else where until prices start showing buying pressure
A break above the trendline would be a possible reversal signal
A break above the trendline would be a possible reversal signal
#LFIN - Good breakout above 67, was the most important level to break IMO. Prices closed on the upper end of today's range which is also a good sign. Risk level is given

#JKH - Strong pullback to support, saw some heavy buying right on support which means buyers are happy to accumulate at the 140 - 142 range. I would like to see 145 broken on good volume to get prices moving again
Another LT stock
Another LT stock

#LOLC - Multiple flags on the hourly chart. The major patterns point towards 730 - 760. If prices can breakout above the current flag, momentum would most likely step in to help prices test 700 - Risk is the higher low

#LLUB - Mostly a dividend counter, but a solid technical setup on the weekly chart with a strong base been forming for years. Yet to see a breakout so no confirmation of upside, but likely to move in anticipation of dividend payments

#NDB - Another LT play IMO. Another heavy resistance in that 100 - 110 range but most important prices yet to breakout above the pattern so no confirmation of the validity of the pattern

#MELS - A great breakout above its primary base. So far prices trading inside that channel. It did try to breakout above it with heavy volume coming in as well, however failed to close above the channel which means further confirmation is needed

#RICH - Massive volume coming in since the start of this week. However, another company which is yet to give a confirmation signal. Heavy resistance awaits prices but something to have on ur watchlist

#RCL - Excellent breakout above another cup and handle pattern and prices finally breaking above the psychological barrier of 50. A good close despite heavy selling. Prices action favors the upside

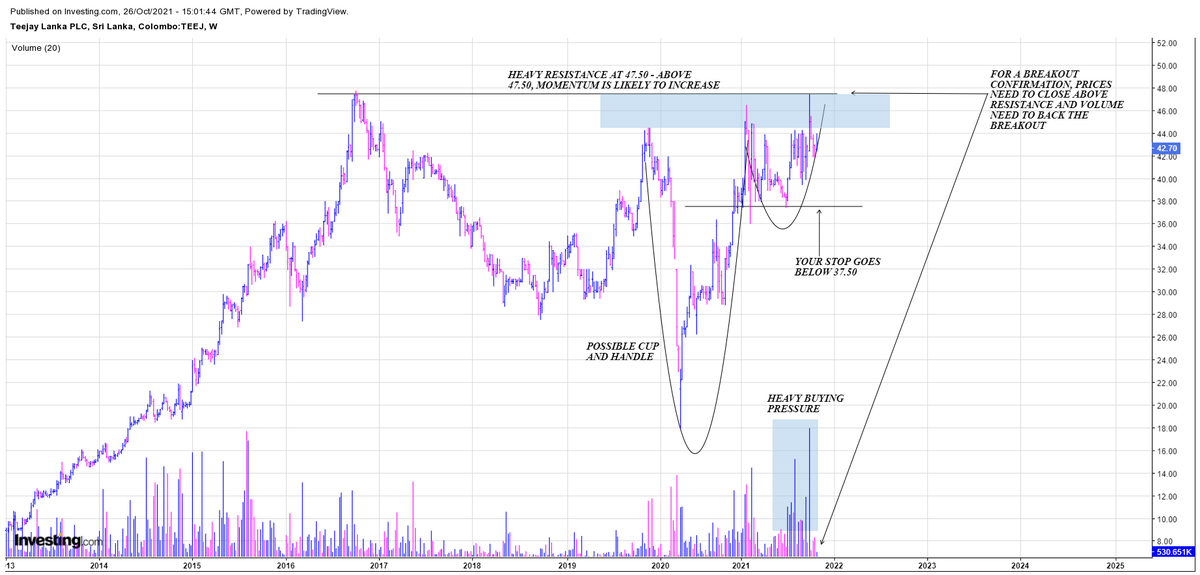
#TEEJ - Heavy resistance awaits near ATHs. No confirmation of a breakout despite seeing some heavy buying pressure as indicated by the large volume spikes. Another potential mover but further confirmation is needed
#SAMP - A bearish pattern but a bullish breakout which is why it's a must to wait for proper confirmation. Another good banking sector stock with a good technical setup. I would watch for that 57.10 level

#VONE - An excellent breakout above that important R level I mentioned last week. Also the breakout was on heavy volume confirming it. The primary pattern gives a TP of 81 - 82 so this has further upside pote tial

#TKYO - Probably the weakest link from the entire index. An ugly gap down and prices still having heavy selling pressure. Alot of work yet to be done here for me to consider turning bullish, the earnings report will play a key role in determining the ST direction

Note - This is not IA, please do your own DD and make the trades your own.
These are just my personal opinions and analysis will vary from person to person
Thank you
These are just my personal opinions and analysis will vary from person to person
Thank you
• • •
Missing some Tweet in this thread? You can try to
force a refresh


