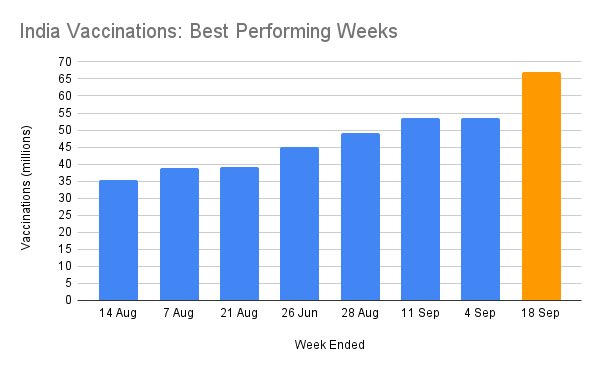
Resuming regular reporting for last week of Oct. Since Dussehra, vaccination has been mostly unremarkable, except that almost every day sees more 2nd doses than first now. This week still sits within the top 10 weeks:
1/
1/
https://twitter.com/surajbrf/status/1451763904263065600

October should end a shade under 180 million doses, around the same ballpark as August, despite 1.5 weeks of the Dussehra festivities.
Data below is up to Oct 30th, i.e. one more day remaining in the month.
2/
Data below is up to Oct 30th, i.e. one more day remaining in the month.
2/

While October seems slower, it has been in fact accounted for more weeks in the top 10 than Aug, though the first wk is mostly driven by the ending days of September.
The holiday interregnum may account for perhaps 30-40 million delayed doses; full month is still ~6m/day.
3/
The holiday interregnum may account for perhaps 30-40 million delayed doses; full month is still ~6m/day.
3/

And how much is 6m/day in relative terms ?
Far ahead of any other major geography. After the lull during Dussehra, the slope of the vaccine doses graph resumes its pace with no other entity managing anywhere close to this rate.
4/
Far ahead of any other major geography. After the lull during Dussehra, the slope of the vaccine doses graph resumes its pace with no other entity managing anywhere close to this rate.
4/


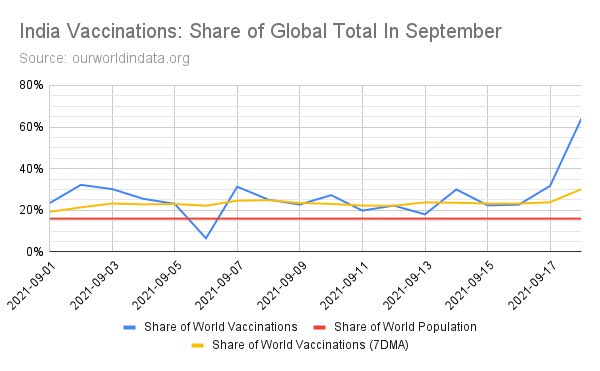
Compared to a collection of major regions and as a share of total world vaccinations, India continues to maintain position in October, accounting for over 24% of world vaccinations, and adding up to the sum of vaccinations in Europe and the Americas.
5/
5/


There’s been some nonsensical press about how Indian vaccinations are sexist and women are not getting doses compared to men.
CoWin data shows:
Men: 54,62,72,710
Women: 51,09,32,307
M/F dose Ratio: 1.069
Indian adult pop sex ratio: 1.069
No shortage of motivated press.
6/
CoWin data shows:
Men: 54,62,72,710
Women: 51,09,32,307
M/F dose Ratio: 1.069
Indian adult pop sex ratio: 1.069
No shortage of motivated press.
6/
This month has been characterized by one notable shift - the first month where second doses exceed the first. In fact, second doses already exceed the total performance in Sept, which had far greater overall doses done:
Current rate is ~4m second doses per weekday.
7/
Current rate is ~4m second doses per weekday.
7/

Given the number of first doses we have seen in June and July, the second dose rate should accelerate further.
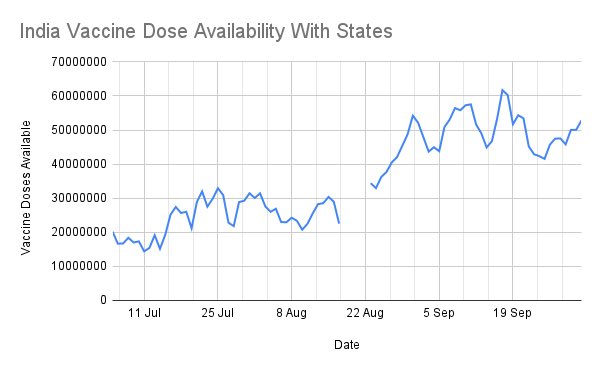
There’s no shortage of doses available. Quite the contrary - availability is at an all time high 127m doses:
8/
There’s no shortage of doses available. Quite the contrary - availability is at an all time high 127m doses:
8/

How many doses were actually supplied in Oct ?
~172m doses performed
Cumulative increase in supply: 78m
Thus 250 million doses were actually supplied by @SerumInstIndia and @BharatBiotech over the course of the month as of end Oct 29th (latest data is on 30th morning).
9/
~172m doses performed
Cumulative increase in supply: 78m
Thus 250 million doses were actually supplied by @SerumInstIndia and @BharatBiotech over the course of the month as of end Oct 29th (latest data is on 30th morning).
9/
November may see 100m second doses being performed, by looking at the number of first doses performed late June-end July.
It will be interesting to see how the first dose count will be kept up. With 732m first doses, 79% of adults already have a first dose. 36% have both.
10/
It will be interesting to see how the first dose count will be kept up. With 732m first doses, 79% of adults already have a first dose. 36% have both.
10/
Globally, most find it hard to keep the curve of the graph pointing up as the saturate first doses, but India isn’t doing badly here.
Second doses on the other hand, India will overtake Europe in November given the steep acceleration now.
11/
Second doses on the other hand, India will overtake Europe in November given the steep acceleration now.
11/


How is India doing in terms of ongoing rate towards the simple extrapolation of completion time ? Even after adjusting all three entities for their current slower rates, not badly:
12/
12/

@PMOIndia and @MoHFW_INDIA has an interesting challenge now:
1. Focus on closing out first doses ? The last mile effort is harder. They’re doing ok relative to others.
2. Accelerate second doses by lowering dose interval ? Possible - they have the doses.
13/
1. Focus on closing out first doses ? The last mile effort is harder. They’re doing ok relative to others.
2. Accelerate second doses by lowering dose interval ? Possible - they have the doses.
13/
November should see Corbevax (Biological-E) available. It is a 2-dose vaccine with 28 day interval like Covaxin.
Another new emphasis is the effort to make vaccines available to children ASAP:
swarajyamag.com/news-brief/bha…
timesofindia.indiatimes.com/city/hyderabad…
livemint.com/news/india/cov…
14/14
Another new emphasis is the effort to make vaccines available to children ASAP:
swarajyamag.com/news-brief/bha…
timesofindia.indiatimes.com/city/hyderabad…
livemint.com/news/india/cov…
14/14
• • •
Missing some Tweet in this thread? You can try to
force a refresh