Suraj Profile picture
2 Nov, 9 tweets, 3 min read
Your argument confuses different things - a statement on a commitment, with raw data. The right relationship is the one between the talking and the walking the talk.

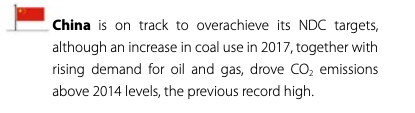
How many of the G20 are in line with their Paris NDCs ? Just ONE - India.

climate-transparency.org/wp-content/upl…

1/
And another:
germanwatch.org/en/19552

The US sits comfortably among the worst in both.

To quote a movie dialogue, your egos writing checks your country can’t cash.

2/
Literally the entirety of your argument is that the 3rd biggest economy (PPP terms) is the third biggest emitter. This is as insightful as arguing that water is wet.

Homilies about big emitters having do ‘do something’ are useless virtue signaling noise.

3/
The US record since Paris is abysmal. And no you don’t get to just throw the last President under the bus. That is simply US domestic politics irrelevant to anyone else. Nations are accountable, not people.

4/
Climate change action happens when countries set credible goals and demonstrate a record of actually meeting them. India rates high on every CTR since Paris. The US doesn’t. Why should anyone assume the US will achieve 2050 goals when its way off track 5 years from Paris ?

5/
China and India know the game here - it’s a bare knuckle fight between the historical culprits - the west - and incremental contributors - the newly industrialized countries. Both sides will point fingers. It’s natural. Here’s one pointed at the west:

6/
You care about climate ? Fine, do this:
- put every single western clean technology on FRAND terms or with no IP protection at all. Anyone can implement it as cheaply as they can.
- put together a large fund any such country can leverage to fund such industrial efforts.

7/
After all this is about saving the planet. So put profit motive aside and put the money and IP where the mouth is.

The west won’t do it , because it’s about the money, technology and industrial power. It is for everyone else too - India and China included.

8/
The west isn’t any better at thinking about the planet or the kids than India or China.

The only metric of any relevance is how good is the west at living up to its existing obligations ? The numbers are right at the start of the thread.

9/9

• • •

Missing some Tweet in this thread? You can try to force a refresh
 

Keep Current with Suraj

Suraj Profile picture

Stay in touch and get notified when new unrolls are available from this author!

Read all threads

This Thread may be Removed Anytime!

PDF

Twitter may remove this content at anytime! Save it as PDF for later use!

Try unrolling a thread yourself!

how to unroll video
  1. Follow @ThreadReaderApp to mention us!

  2. From a Twitter thread mention us with a keyword "unroll"
@threadreaderapp unroll

Practice here first or read more on our help page!

More from @surajbrf

2 Nov
Long track record of covering India and @narendramodi eh ? Let's look at the past 4 Climate Transparency Reports since Paris 2016, to confirm your tracking capability:

2017: climate-transparency.org/wp-content/upl…

India and US blurbs:

1/
2018: climate-transparency.org/wp-content/upl…

India, China and US blurbs:

2/
2019: climate-transparency.org/wp-content/upl…

India, China and US blurbs again:

3/
Read 7 tweets
1 Nov
This thread celebrates the occasion of UPI transaction value crossing the $100 billion a month mark, reaching $103 billion in Oct 2021, up from $87 billion in Sept.

npci.org.in/what-we-do/upi…

UPI transaction value grew 18% MoM in Oct, aided by a 17% MoM growth in volume.

1/
Trailing 12 month transaction volume is now 34.5 billion . This is by a distance the most of any country in the world, having gained almost 10 billion from the FY 2020-21 end volume: dazeinfo.com/2021/05/11/rea…

The slope of this graph is going parabolic:

2/
Trailing 12-month transaction value is currently $852 billion, on track to cross $1 trillion before fiscal year end in March 2022.

The value graph is also accelerating now, and in fact Covid was an inflection point from where UPI has accelerated in adoption and use.

3/
Read 10 tweets
30 Oct
Resuming regular reporting for last week of Oct. Since Dussehra, vaccination has been mostly unremarkable, except that almost every day sees more 2nd doses than first now. This week still sits within the top 10 weeks:

1/ Image
October should end a shade under 180 million doses, around the same ballpark as August, despite 1.5 weeks of the Dussehra festivities.

Data below is up to Oct 30th, i.e. one more day remaining in the month.

2/ Image
While October seems slower, it has been in fact accounted for more weeks in the top 10 than Aug, though the first wk is mostly driven by the ending days of September.

The holiday interregnum may account for perhaps 30-40 million delayed doses; full month is still ~6m/day.

3/ Image
Read 14 tweets
23 Oct
This week’s update will only briefly cover performance - weekly total likely to be ~42 million, same as late Aug/early Sep rate after 1.5 weeks of festival driven slowdown.

The main topic this week is a numerical dive into the 1 billion doses administered performance.

1/
This is of course just the doses administered within India. Total production is approximately 1.25 billion, including supplies sitting with states, exports and wastage.

Covishield exceeds 1 billion doses produced.
Covaxin exceeds European Moderna output, close to US.

2/
Approx 6 billion doses of COVID-19 vaccines have been produced worldwide. 6 entities account for almost all of it: China, India, EU, US, UK and Russia.

India’s peers are lower middle income countries. But it ranks #2 in vaccine output.

3/
Read 19 tweets
10 Oct
Updating for Oct 2nd week. It’s known that this is a slow week. How slow ? ‘Only’ 42.5 million, still among the top 8 weeks.

Various theories have been offered regarding this slowdown so we will look at some associated data.

1/
This week, the daily bucket chart also highlights weekday public holidays that affect footfalls:
Eid Jul 21
Janmashtami Aug 30
Ganesh Chaturthi Sep 10
Navratri Oct 7-15

Lesser/regional holidays have been skipped only due to lack of pan-India data impact.

2/
The vaccine availability chart shows anomalous behavior this month - rather than a seesaw between supply and use, it has risen until 10th.

Oct started with 50m doses, supply rose to 85m, while consumption was 42.5m -> 77.5m doses supplied, or likely ~265m for the month.

3/
Read 11 tweets
2 Oct
Updating for the start of October. The prior week had 49 million doses. A soft period coming on the back of successive weeks of high performance dominating the top 5 in this chart:

1/
The primary reason for this is a softness in supply coming on the back of 4 long weeks of high performance. However this is now improving as the graph shows, with the available supply back over 50M :

2/
Weekly performance remained steady with no major movement. Trailing 7DMA is now a shade under 7M/day but should go up soon.

I may stop presenting this chart. Oct is likely to have many days over 10M, which this doesn’t show well. If you like this data, please say so.

3/
Read 11 tweets

Did Thread Reader help you today?

Support us! We are indie developers!


This site is made by just two indie developers on a laptop doing marketing, support and development! Read more about the story.

Become a Premium Member ($3/month or $30/year) and get exclusive features!

Become Premium

Too expensive? Make a small donation by buying us coffee ($5) or help with server cost ($10)

Donate via Paypal Become our Patreon

Thank you for your support!

Follow Us on Twitter!

:(