#Argy Construccion y salarios minimos respecto a EEUU. Hilo: Abajo vemos los salarios minimos en cada pais, proyectando si volvemos a maximos en argy con atraso cambiario salarios minimos de 1200 usd,dado q medido en maximos llevan una relacion 3.2 salarios argy forman uno en usa
Cant de salarios argentinos q se necesitan para comprar un salario Americano en picos de crisis. y en la parte mas baja vemos valores de 3,2 salarios argy por salario en usa alla por año 2011. (Siempre tomando valor dolar libre)
En el caso de la construccion nos da una relacion en maximos de 1/3.33. nos llevaria a un Costo minimo de construccion de 1045 dol el m2, siempre tomando recuperaciones en maximos y con atraso cambiario como periodos 2012 y 2018 donde se ven los saltos en el grafico
Si sacamos un ratio entre costo construccion argy contra costo materiales usa nos da que ya estamos por debajo de valores 2001
Finalmente el costo contruccion medido en onza de oro nos da valores hiper del 89, digamos q estamos en un piso duro medido en moneda dura
Hilo- ¿Por qué los argentinos podrían ser los más afectados del mundo por esta medida de la Reserva Federal Norteamericana? FLOJO el @Cronistacom en no poner en alerta a la población de sus implicancias. cronista.com/finanzas-merca…. Abro Hilo
1-Una CBDC es una moneda digital(como el dinero actual)pero que opera mediante blockchain, lo que permitirá mucha mas agilidad a las transacciones y consensos, entre otras cosas (hoy obsoletos con el sistema SWIFT). Tambien permitira la eliminacion de la banca comercial
2-Estos son algunos aspectos de por qué son ventajosas. Pero por el lado malo, tenemos: mayor centralización de la moneda, posibilidad de programación de la misma entre otras. Me voy a detener un seg. en la programación de las mismas.
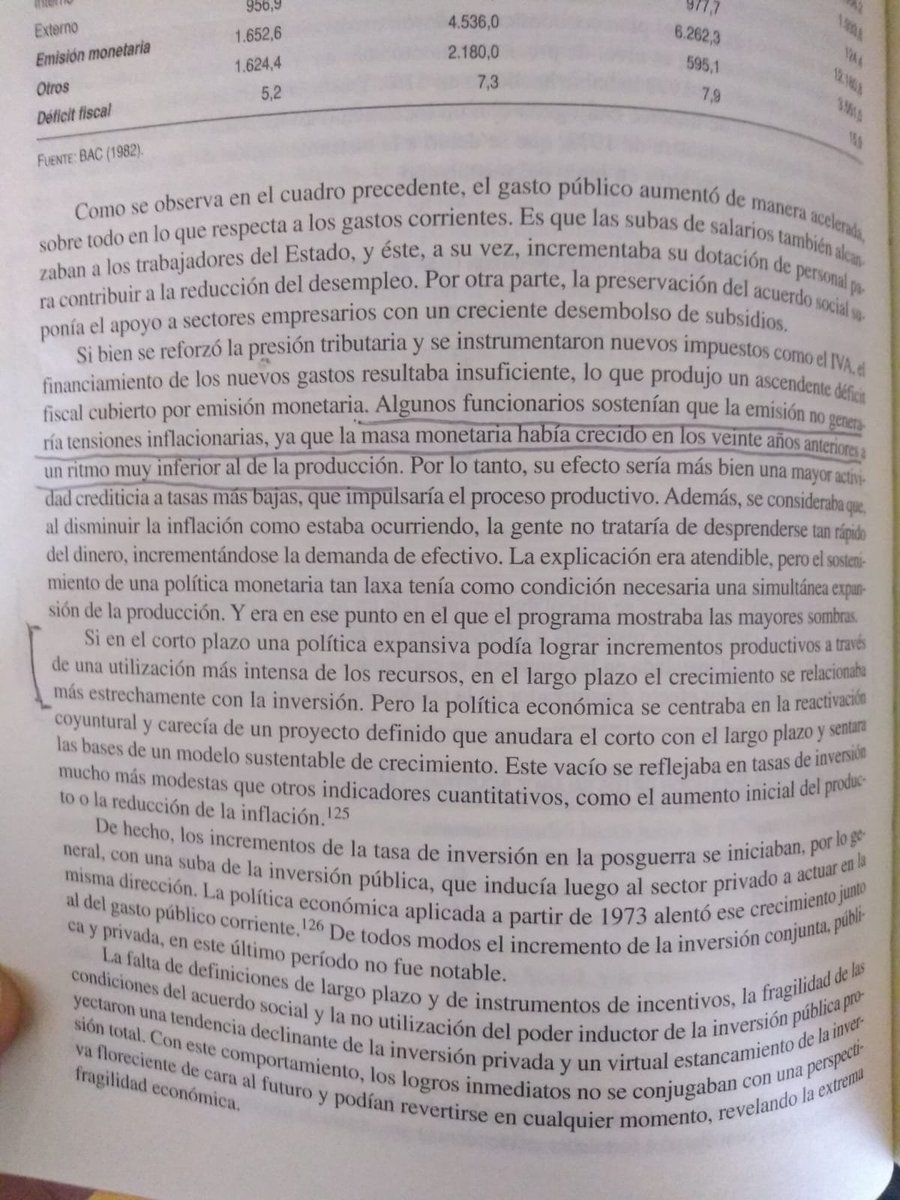
Hilo 1- parte de la antesala del #rodrigazo fue la caida de las materias primas que exportamos y el aumento de la energia q importabamos te suena? mira este ratio mientras mas aumenta la energia con respecto a los alimentos, mas cae.Te dejo un fragmento de un libro Mario Rapoport
1-Modern monetarists or Keynesians want to convince us that as long as the economy grows by 2% and issuance is 2%, that does not generate inflation. Of course, it does not produce inflation from 0 onwards, but it does not allow deflation to arise.
2-what sense does it make to producers to let the GOV introduce more MONEY if we already sow that it is not necessary to let trade flow, only smaller units are needed in deflationary economies. see this thread
3-it is not logical that producers of goods and services generate economic and productive effort to produce and GOV without any effort or any benefit for society, introduce at ZERO cost more monetary units. literally zero with digital money
1-Realized Cap values different part of the supplies at different prices (instead of using the current daily close). Specifically, it is computed by valuing each UTXO (Unspent transaction output) by the price when it was last moved.
2-in plain english its like financial cap or all real money destinated to buy each coin. In retrospective MARKET CAP is more known (all coins in existence times de value of btc) but this isnt the real Money that come in to the space of btc, realizad cap is a better measure for it
3- The diference between r.cap and mkt cap is the profit of all the Holders given in the way they were bought in time and price. Looking at the graph we see less amount of money that flows in the mkt makes the price move faster,
THREAD1-gdp measured against m2 is the velocity of money. This measures inflation or deflation, velocity spikes when gdp grow faster than m2, people run off money because rising prices, we are going to apply this comparison against other asset (btc, gold,dow j.) instead of GDP
2-as u can see in the previous chart since 00´s the veloc. wont stop from falling, this is deflation in GDP in the real economy, thats because m2 rise faster than gdp can grow, so where is all that money going? will see
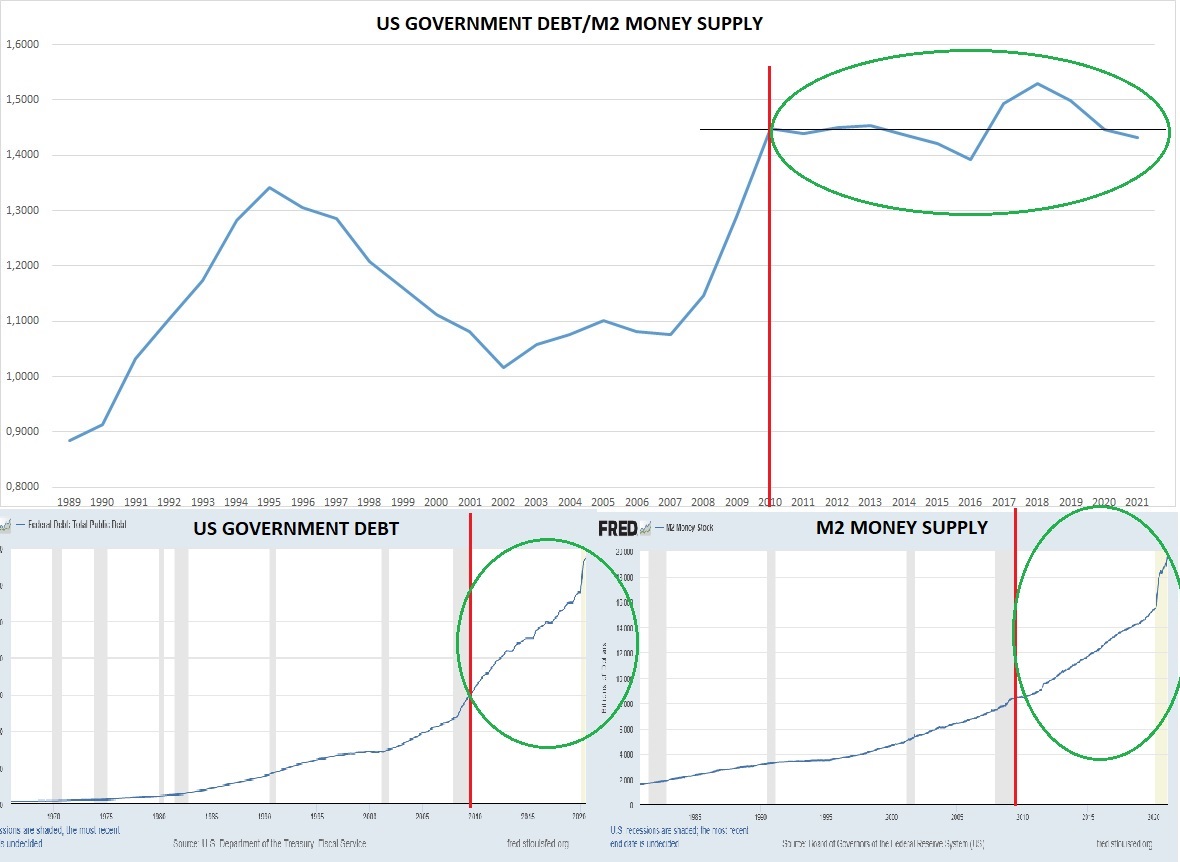
3-two charts gov.debt and m2, you can calculate the velocity of debt as in the past graph you got the velocity of money in the economy. see the las 10 years a sideways patern and stop from rising, means that debt colocation is less against m2 printing machine.
thread1-2008 broke the trendline, this means that money supply increase faster and higher than gdp can grow. You can also see brown line entering in a down patern with lower highs. this is because money isnt going to real economy but going to bonds and stocks and other spec. as.
thread2-If FED is injecting 100 usd to get 100 usd or less growth in gdp, it means that economy is not getting real growth is a zero sum game, thats why you can see the decouple of the brown line since 2008, meaning new printed dollars doesnt make a real growth in usd terms
Thread3- here u can see that money printing is getting parabolic while gdp is rising in a constant trend, showing that you need more dollars to get the same constant growth.