
You may have noticed that there was no specific chapter on paleoclimate in the 2021 AR6 @IPCC_CH #ClimateReport - while there were dedicated chapters in the previous AR4 (2007) and AR5 (2013) WGI reports.
Why? ⬇️
🧵
(1/...)
Why? ⬇️
🧵
(1/...)
The 2021 #ClimateReport was structured to integrate all available lines of evidence in a holistic approach to more fully understand the climate system – including observation, modelling, process understanding, and insights from past climates.
(2/...)
(2/...)

There are widespread insights reflected in this report which arise from advances in reconstructing, modelling and understanding past climate variations.
This is reflected in these examples of climate science milestones (Figure 1.6)
(3/...)
This is reflected in these examples of climate science milestones (Figure 1.6)
(3/...)

You will find a summary of how knowledge on past climate is addressed in this report, and how it advances our understanding, in the Technical Summary (Box 2), available here : ipcc.ch/report/ar6/wg1/
Here are a few highlights, based on key figures from the whole report.
(4/...)
Here are a few highlights, based on key figures from the whole report.
(4/...)
Paleo evidence extends instrument-based observations of climate variables and climate drivers back in time, providing the long-term context needed to gauge the extent to which recent and potential future changes are unusual.
Example : 2000 year context (Figure 1.26)
(5/...)
Example : 2000 year context (Figure 1.26)
(5/...)

In fact, levels of global warming that have not been seen in millions of years could be reached by 2300, depending on the emissions pathway that is followed (Figure TS.1).
(6/...)
(6/...)

For instance, the last time global surface temperature was sustained at or above 2.5°C was over 3 million years ago. This could be reached by 2100 if greenhouse gas emissions stay close to today's levels over a few more decades (yellow).
(7/...)
(7/...)
This knowledge arises from the study (field work for sampling / coring / drilling, dating, proxy records, calibrations, reconstructions) from broad range of natural archives (Chapter 1, Figure 1.7).
(8/...)
(8/...)

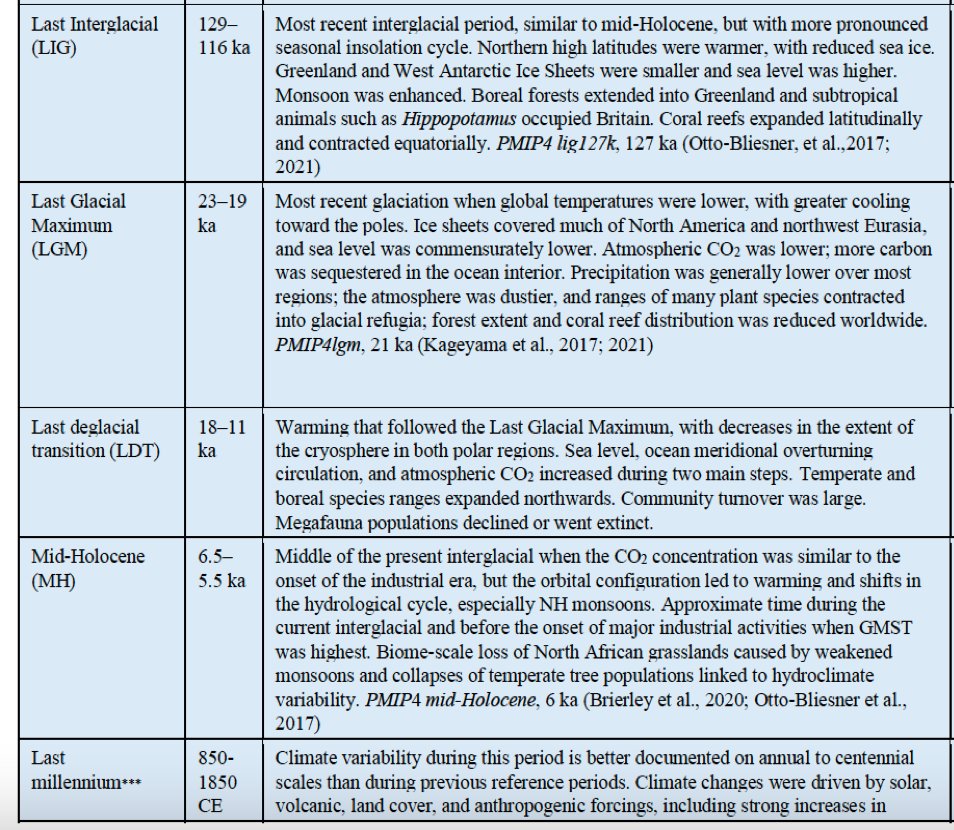
Some specific past periods have received extensive research attention, as examples of distinct climate states, or rapid climate transitions (Chapter 2, Figure 2.34; Cross-Chapter Box 2.1, Table 1)
(9/...)
(9/...)

They have different natural drivers and characteristics.
I see them as "natural experiments" on the Earth's climate.
Some are a focus for paleoclimate modelling inter-comparisons, as illustrated here (Box TS.2)
(10/...)
I see them as "natural experiments" on the Earth's climate.
Some are a focus for paleoclimate modelling inter-comparisons, as illustrated here (Box TS.2)
(10/...)


This advances our understanding of the climate response to forcing, and provides a benchmark to assess the ability of climate models to simulate past natural variations.
Agreement for global surface temperature across periods (Technical Summary, Box TS.2)
(11/...)
Agreement for global surface temperature across periods (Technical Summary, Box TS.2)
(11/...)

Natural archives are used to characterize past radiative forcing associated with changes in solar activity and volcanic activity (Chapter 1, Figure 2.2)
(radiative forcing left axis, + means warming, - cooling effect)
(12/...)
(radiative forcing left axis, + means warming, - cooling effect)
(12/...)

Natural climate variability during the past centuries is dominated by the effect of major volcanic eruptions,
(13/...)
(13/...)
and climate models broadly reproduce surface temperature variations over the past millennium, including the cooling that follows periods of intense volcanism (Chapter 3, Figure 3.2c)
(14/...)
(14/...)

When looking at systematic comparisons between paleoclimate reconstructions and model simulations, for the last glacial maximum and the mid-Holocene, models tend to underestimate the magnitude of large changes (Chapter 3, Figure 3.44)
(15/...)
(15/...)

Human-caused radiative forcing drives an accumulation of additional energy (heating) in the climate system (Figure TS.9)
(16/...)
(16/...)

Based on paleoclimate and historical evidence, it is likely that at least one large explosive volcanic eruption would occur during the 21st century.
(17/...)
(17/...)
Such an eruption would reduce global surface temperature and precipitation, especially over land, for one to three years, alter the global monsoon circulation, modify extreme precipitation and change many climatic impact-drivers.
(18/...)
(18/...)
If such an eruption occurs, this would therefore temporarily and partially mask human-caused climate change.
(19/...)
(19/...)
A sequence of large explosive volcanic eruptions within decades has occurred in the past, causing substantial global and regional climate perturbations over several decades.
(20/...)
(20/...)
Such events cannot be ruled out in the future, but due to their inherent unpredictability they are not included in the illustrative set of scenarios referred to in this report (but there is a dedicated box, Cross-Chapter Box 4.1, Figure 1)
(21/...)
(21/...)

Improvements in observationally based estimates and information from paleoclimate archives provide a comprehensive view of each component of the climate system and its changes to date (FAQ2.1)
(22/...)
(22/...)

Human influence has warmed the climate at a rate that is unprecedented in at least the last 2000 years (Figure SPM.1)
(23/...)
(23/...)

Temperatures in 2011-2020 exceed those of the most recent multi-century warm period, around 6500 years ago. Prior to that, the next most recent warm period was about 125,000 years ago when the multi-century temperature overlaps the observations of the last decade (Box TS.1)
(24)
(24)

The scale of recent changes across the climate system as a whole and the present state of many aspects of the climate system are unprecedented over many centuries to many thousands of years (adapted from FAQ1.1)
(25/...)
(25/...)

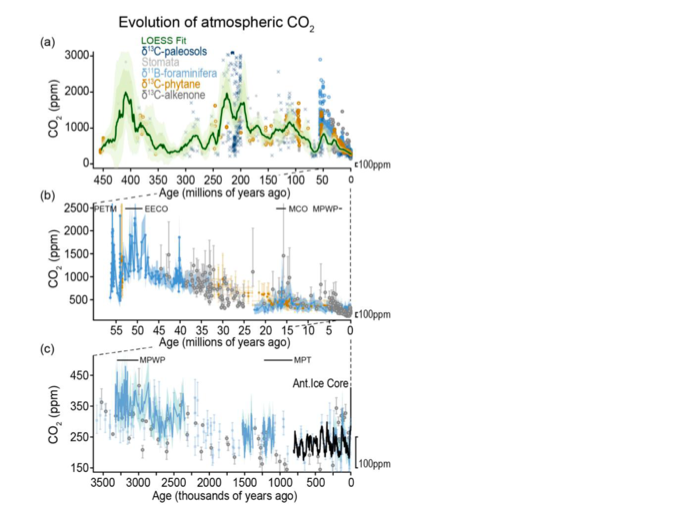
In 2019, atmospheric CO2 concentrations were higher than at any time in at least 2 million years and concentrations of CH4 and N2O were higher than at any time in at least 800,000 years (Figures 2.3)
(26/...)
(26/...)
See the differences in rates of changes! (Figure 5.3)
(27/...)
(27/...)

Since 1750, increases in CO2 (47%) and CH4 (156%) concentrations far exceed, and increases in N2O (23%) are similar to, the natural multi-millennial changes between glacial and interglacial periods over at least the past 800,000 years (Figures 2.4 and 5.4)
(28/...)
(28/...)


Projections of regional changes can also be compared to past hydroclimate variability.
(29/...)
(29/...)
In the Mediterranean, southwestern South America, and western North America, future aridification will far exceed the magnitude of change seen in the last millennium (Figure 8.20)
(30/...)
(30/...)

Pre-industrial climate states complement evidence from climate model projections by providing real-world examples of climate characteristics for past global warming levels,
(31/...)
(31/...)
with empirical evidence for how the slow-responding components of the climate system operate over centuries to millennia – the time scale for committed climate change.
(32/...)
(32/...)


Insights from past climates also show larger surface temperature changes over land than over sea, a feature which is observed for ongoing warming, and simulated for past and future changes.
(33/...)
(33/...)
For instance, global surface temperature was about 1.1°C higher in 2011–2020 than 1850–1900, with larger increases over land (about 1.6°C) than over the ocean (about 0.9°C). Here, Figure 3.2
(34/...)
(34/...)

What can the past tell us about the future? (FAQ1.3)
(35/...)
(35/...)

Changes are irreversible on centennial to millennial time scales in global ocean temperature, deep ocean acidification and deoxygenation (Chapter 9, Figure 9.9)
(36/...)
(36/...)

In the longer term, sea level is committed to rise for centuries to millennia due to continuing deep ocean warming and ice sheet melt, and will remain elevated for thousands of years (Figure 1.5)
(36/...)
(36/...)

Over the next 2000 years, global mean sea level will rise by about 2 to 3 m if warming is limited to 1.5°C, 2 to 6 m if limited to 2°C and more for further warming, and it will continue to rise over subsequent millennia (Infographics TS.1)
(37/...)
(37/...)

Projections of multi-millennial global mean sea level rise are consistent with reconstructed levels during past warm climate periods (Box TS.4, Figure 1)
(38/...)
(38/...)

What do we know about the climate of the Pliocene, around 3 million years ago, when sustained CO2 concentrations were last similar to those of present-day? (Chapter 2,Cross-Chapter Box 2.4, Figure 1)
(39/...)
(39/...)
Gobal mean surface temperature was 2.5°C–4.0°C higher, biomes expanded poleward, precipitation rates were higher and monsoon systems stronger.
Global mean sea level was between 5 and 25 m higher than present, with reduced ice sheets.
Global mean sea level was between 5 and 25 m higher than present, with reduced ice sheets.

This is a more detailed comparison of models and paleo data for global mean sea-level commitment as a function of peak global warming (Figure 9.30)
(41/...)
(41/...)

Abrupt responses and tipping points of the climate system, such as strongly increased Antarctic ice sheet melt and forest dieback, cannot be ruled out.
(42/...)
(42/...)
The probability of low-likelihood, high impact outcomes increases with higher global warming levels.
(43/...)
(43/...)
The Atlantic Meridional Overturning Circulation is very likely to weaken over the 21st century for all emission scenarios. While there is high confidence in the 21st century decline, there is only low confidence in the magnitude of the trend.
(44/...)
(44/...)
There is medium confidence that there will not be an abrupt collapse before 2100.
(45/...)
(45/...)
If such a collapse were to occur, it would very likely cause abrupt shifts in regional weather patterns and water cycle (Figure 8.27)
(46/...)
(46/...)

... such as a southward shift in the tropical rain belt, weakening of the African and Asian monsoons and strengthening of Southern Hemisphere monsoons, and drying in Europe.
(47/...)
(47/...)
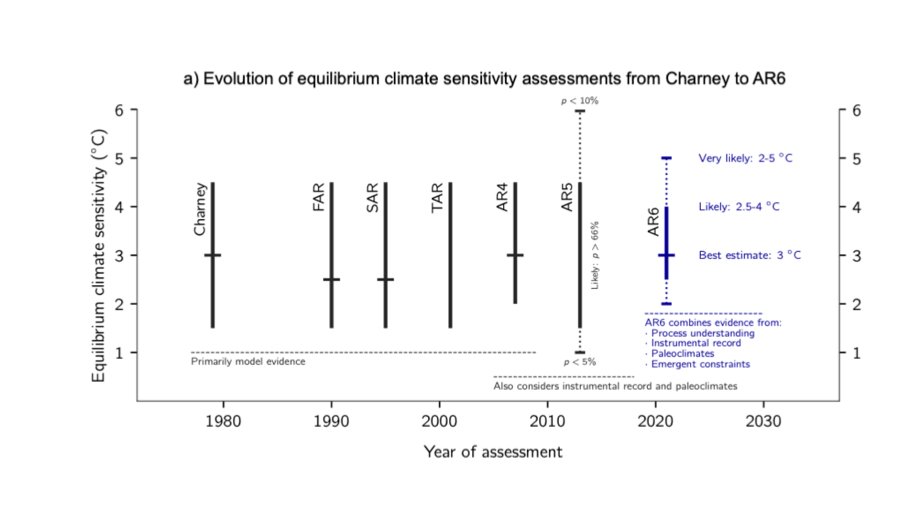
Information about the state of the climate system during well-described paleoclimate reference periods helps narrow the uncertainty range in the overall assessment of Earth’s sensitivity to climate forcings
(48/...)
(48/...)
Based on multiple lines of evidence, the very likely range of equilibrium climate sensitivity is between 2°C and 5°C. The assessed best estimate is 3°C with a likely range of 2.5°C to 4°C, compared to 1.5°C to 4.5°C in the previous 2013 report (Figure TS16)
(49/...)
(49/...)
Overall, independent lines of evidence from models and from the paleoclimate proxy record lead to high confidence that the net feedback parameter, α, increases as temperature increases; i.e., that sensitivity to forcing increases as temperature increases (Figure 7.11)
(50/...)
(50/...)
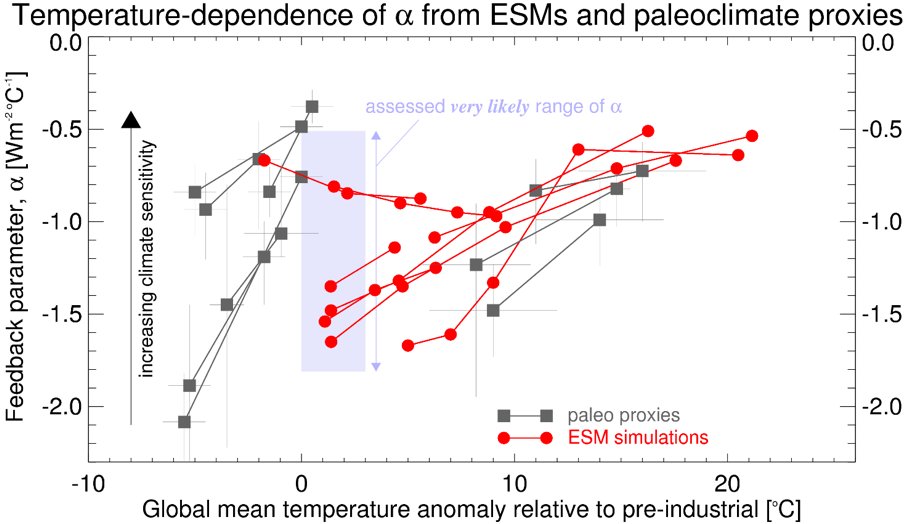
Due to the large range in estimate of the magnitude of the temperature dependence, a quantitative assessment cannot currently be given, or included in emulator-based future projections.
(51/...)
(51/...)
The overall inter-model spread in equilibrium climate sensitivity for CMIP6 is larger than for CMIP5
This is related to shortwave cloud feedback (eg. extra-tropical clouds with mixed ice and liquid phases).
(Figure TS.16)
(52/...)
This is related to shortwave cloud feedback (eg. extra-tropical clouds with mixed ice and liquid phases).
(Figure TS.16)
(52/...)

Some models with high ( greater than 5°C) and low ( less than 2°C) equilibrium climate sensitivity are less consistent with past climate change (Figure 7.19)
(53/...)
(53/...)

Proxy reconstructions and simulations show polar amplification for glacial and hot periods. The confidence in the ability of models to accurately simulate polar amplification is higher than at the time of AR5 (Figure 7.13)
(54/...)
(54/...)

Paleoclimate reconstructions from proxy archives play a key role to advance our understanding of past climate.
(55/...)
(55/...)
😢 Paleoclimate archives such as mid-latitude and tropical glaciers and modern natural archives used for calibrations (eg. corals and trees) are rapidly disappearing owing to a host of pressures, including increasing temperatures.
(56/...)
(56/...)
Altogether, advances in paleoclimatology have contributed to better understanding of climate change (FAQ1.1)
(57/...)
(57/...)

I expect knowledge advances in the coming years and decades, in particular from new proxy sources, advances in dating and increased temporal resolution, improved reconstructions, model-data integrations, including data assimilation & emergent constraints from paleoclimate.
- END
- END
• • •
Missing some Tweet in this thread? You can try to
force a refresh


