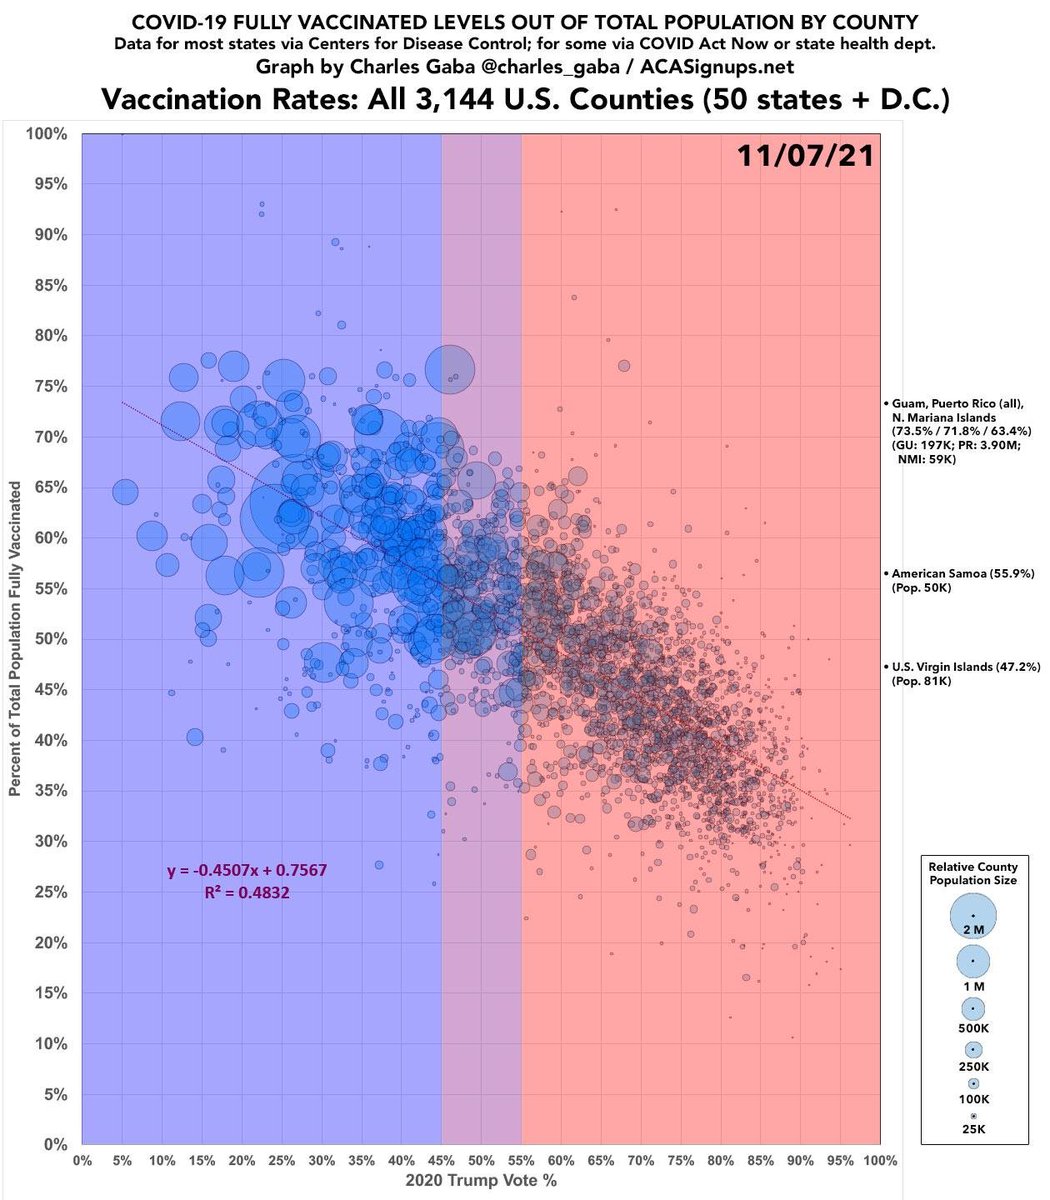
America 2021 in one image.
For those wondering:
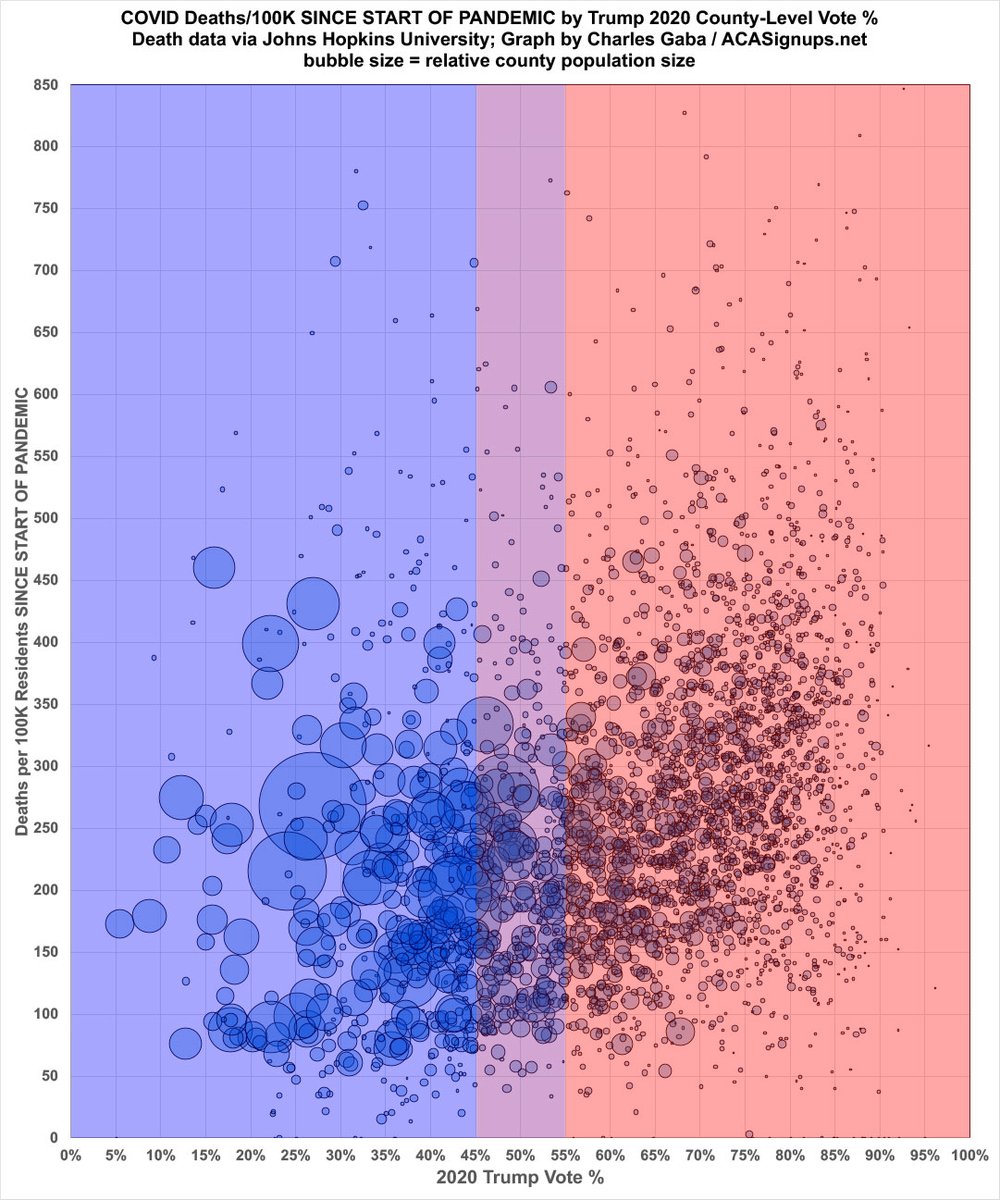
—bubble size indicates county population size
—data is thru yesterday (11/12/21).
Several people are accusing me of “cherry picking” by starting on 6/30/21 instead of going back to the start of the pandemic. It’s hardly breaking news that the first wave in March/April 2010 slammed densely-populated blue areas far heavier than sparsely-populated red areas. 1/
Obviously there’s some pretty damned important differences between early 2020, when few people knew what the hell was going on, there was little testing, no mask-wearing, no social distancing and NO VACCINES…and summer/fall 2021. 2/
Also, the first wave was the original variant. July 2021 was when the FAR more communicable Delta variant started to hit the U.S.

Having said that, I’ll be happy to run this dating back to early 2020 for comparison. My guess is it red counties will still be a bit higher. 3/3
📣 As promised, here's the same graph w/CUMULATIVE county-level deaths *since the start of the pandemic*.

As I suspected, the reddest tenth of the country is still running about 50% higher than the bluest tenth even when you include that horrific first wave in NY/NJ/etc.
Meanwhile, here's the first graph (since June only) broken out into 10ths of the population in bar graph format...
...and here's the second graph (cumulative since January 2020) broken out into bar graph format:
FYI to everyone reading this thread: I'll be posting a deeper dive into these data/graphs tomorrow at ACASignups.net. Stay tuned...
📣 ⚠️ In fact, along with some other interesting tidbits, I just discovered one hell of a jaw-dropping data point.

I had to triple check to make sure I had it right.

Stay tuned...
HINT:

• • •

Missing some Tweet in this thread? You can try to force a refresh
 

Keep Current with Charles #GetCovered-ba 🩺

Charles #GetCovered-ba 🩺 Profile picture

Stay in touch and get notified when new unrolls are available from this author!

Read all threads

This Thread may be Removed Anytime!

PDF

Twitter may remove this content at anytime! Save it as PDF for later use!

Try unrolling a thread yourself!

how to unroll video
  1. Follow @ThreadReaderApp to mention us!

  2. From a Twitter thread mention us with a keyword "unroll"
@threadreaderapp unroll

Practice here first or read more on our help page!

More from @charles_gaba

12 Nov
📣 BREAKING: 2022 HealthCare.Gov #ACA Open Enrollment up 20% vs. last year in first week:
acasignups.net/21/11/12/2022-…
Even more remarkable: NEW enrollment is only down 2.5% y/y when adjusted for fewer days & fewer states being hosted on the federal exchange...this is AMAZING considering over 2M people already enrolled via the COVID Special Enrollment Period!
Also noteworthy: Active renewals are up 26% year over year, which is good because it suggests more people are wising up to the merits of ACTIVELY re-enrolling vs auto-renewing.
Read 5 tweets
11 Nov
Meanwhile, South Dakota’s Attorney General killed a man, lied about it (he claimed he thought he’d hit a deer even though the man’s glasses were found in his car after his head smashed through the windshield) and is facing impeachment over it. #BothSides!
Image
Read 4 tweets
8 Nov
In which I get a nice shoutout from @DLeonhardt in his updated look at the COVID red/blue divide:
nytimes.com/2021/11/08/bri…
FWIW, I’m just waiting on Florida county data to be released later this morning before posting the latest red/blue divide update (I have every other state updated already). Stay tuned…
📣 NOW LIVE: Here's an updated look at county-level #COVID19 case & death rates by partisan lean & vaccination rates:
acasignups.net/21/11/08/weekl…
Read 8 tweets
8 Nov
Yeah, that's right: We have exactly 1 year before Election Day 2022 and I'm launching Phase 2 of my Dem candidate fundraising project.
Last cycle I raised $6 million for Dem candidates up & down the ballot.

I'm at $86,000 so far halfway through this cycle. Let's catch up a bit, shall we?
secure.actblue.com/donate/senateb…
Read 4 tweets
7 Nov
📣 WEEKLY UPDATE: U.S. #COVID19 vaccination rates by county & Trump vote:
acasignups.net/21/11/07/weekl…
It should be fascinating to see whether the slope or correlation level (R2) of this graph changes starting on Thanksgiving (that's when the first batch of 5-11 yr olds getting their *second* Pfizer shot should start showing up in the data reports)...
As you can see, the partisan correlation rate increased continuously from the moment eligibility for all adults started in mid-March all the way through mid-September...at which point it basically plateaued. It's remained steady ever since.
Read 6 tweets
7 Nov
MICHIGAN FOLKS: I just took my first phone survey of the 2022 election cycle, via an outfit calling itself VRI Research, focused almost exclusively on the bullshit "Secure MI Vote" ballot proposal.
michigandems.com/toolkit/declin…
The "Secure MI Vote" proposal is a scam; DO NOT SIGN THE PETITION. The MI GOP's goal is to get enough signatures that they can use a jaw-droppingly stupid loophole in the MI Constitution which would let them pass it into law without allowing @GovWhitmer the ability to veto it.
As for the survey itself, at times it sounded like a push poll, but at other times it got very confusing--several of the ways the arguments given in favor/against the proposal were worded were double-negatives, making it difficult to tell which way the argument was even leaning.
Read 5 tweets

Did Thread Reader help you today?

Support us! We are indie developers!


This site is made by just two indie developers on a laptop doing marketing, support and development! Read more about the story.

Become a Premium Member ($3/month or $30/year) and get exclusive features!

Become Premium

Too expensive? Make a small donation by buying us coffee ($5) or help with server cost ($10)

Donate via Paypal

Thank you for your support!

Follow Us on Twitter!

:(