No decline in real world effectiveness of vaccine against death & hospitalisation. Graphs are drawn from Minnesota data.

I have used a ratio of event rates among unvaccinated : vaccinated population. The graphs show death & hospitalisation rates.

1/5

health.state.mn.us/diseases/coron…
The ratios are based on vaccination % prevailing 30 days prior to each data point, so that it reflects the true effect of vaccination.

It must also be kept in mind that the vaccinated segment by default are older, more likely to fall sick and have serious outcomes.

2/
This implies that the ratios are an underestimate of the true protection offered by vaccines.

In other words, we are not comparing groups of equal health status when we do a ratio of the unvaccinated and vaccinated.

The true protection will be larger.

3/
We must also factor in the “parallel immunisation process” that occurs in the unvaccinated group - on account of their picking up immunity due to asymptomatic and symptomatic natural infections.

This will eventually be reflected in their event rates in subsequent months.

4/
A similar trend was observed in Oregon, I had tweeted earlier on the event rates, and the ratio remained consistently at around 2.8.

Obviously real-world effectiveness studies have their limitations, but these are state-reported data and probably the most reliable.

5/5

• • •

Missing some Tweet in this thread? You can try to force a refresh
 

Keep Current with Rajeev Jayadevan

Rajeev Jayadevan Profile picture

Stay in touch and get notified when new unrolls are available from this author!

Read all threads

This Thread may be Removed Anytime!

PDF

Twitter may remove this content at anytime! Save it as PDF for later use!

Try unrolling a thread yourself!

how to unroll video
  1. Follow @ThreadReaderApp to mention us!

  2. From a Twitter thread mention us with a keyword "unroll"
@threadreaderapp unroll

Practice here first or read more on our help page!

More from @RajeevJayadevan

15 Nov
Two doses of vaccine generate long-lived and stable Memory T cells.

The longevity of immune response to SARS-CoV2 virus depends on the presence and stability of memory cells of the B & T genre.

This is a landmark paper from Rome by Guerrera et al.

1/

science.org/doi/10.1126/sc…
The presence of long lived memory B cells had previously been established in several papers, see my tweets. This paper focuses on memory T cells in response to 2 doses of mRNA vaccine.

I will discuss some basic immunology first, to help understand the context of this paper.

2/
Following the innate response, the adaptive immulogical response to a virus infection is basically two pronged.

The two arms are T cells and B cells.

B cells make antibodies which work like security guards OUTSIDE our gate, preventing the thief from entering the premises.

3/
Read 14 tweets
14 Nov
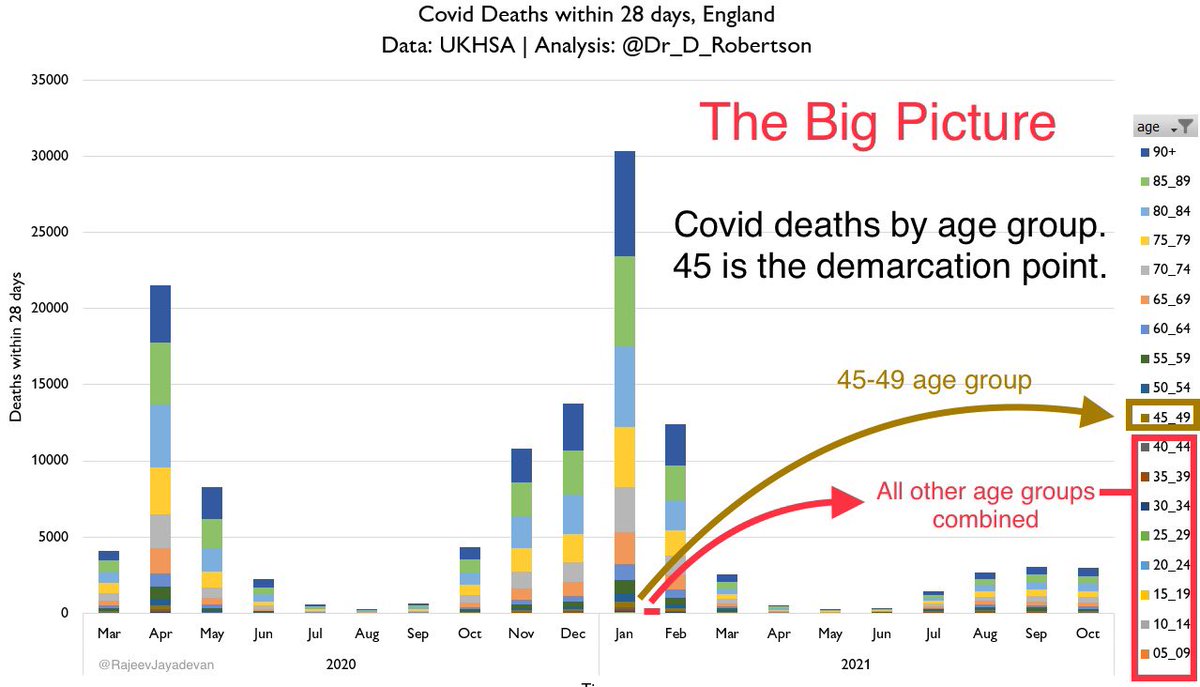
The most powerful graph that I have seen of the pandemic.

This calls for a rethink of vaccination strategy.

Note the sharp demarcation around age 40-45.

Vaccination of this 40+ segment needs priority.

Below that age, it could even be made optional. Here’s why👇

(Thread)
Although vaccines were launched with a hope of stopping transmission and further waves, we have seen that high % vaccination coverage does not stop subsequent waves. This is because they are ineffective in providing mucosal immunity; virus is silently spreading in communities.
2/
At the same time, we have found that vaccines are not 100% benign products as is often suggested by certain academics.

They have failed to acknowledge the small but significant number of serious and fatal outcomes is that occurred - particularly among younger individuals.

3/
Read 31 tweets
30 Oct
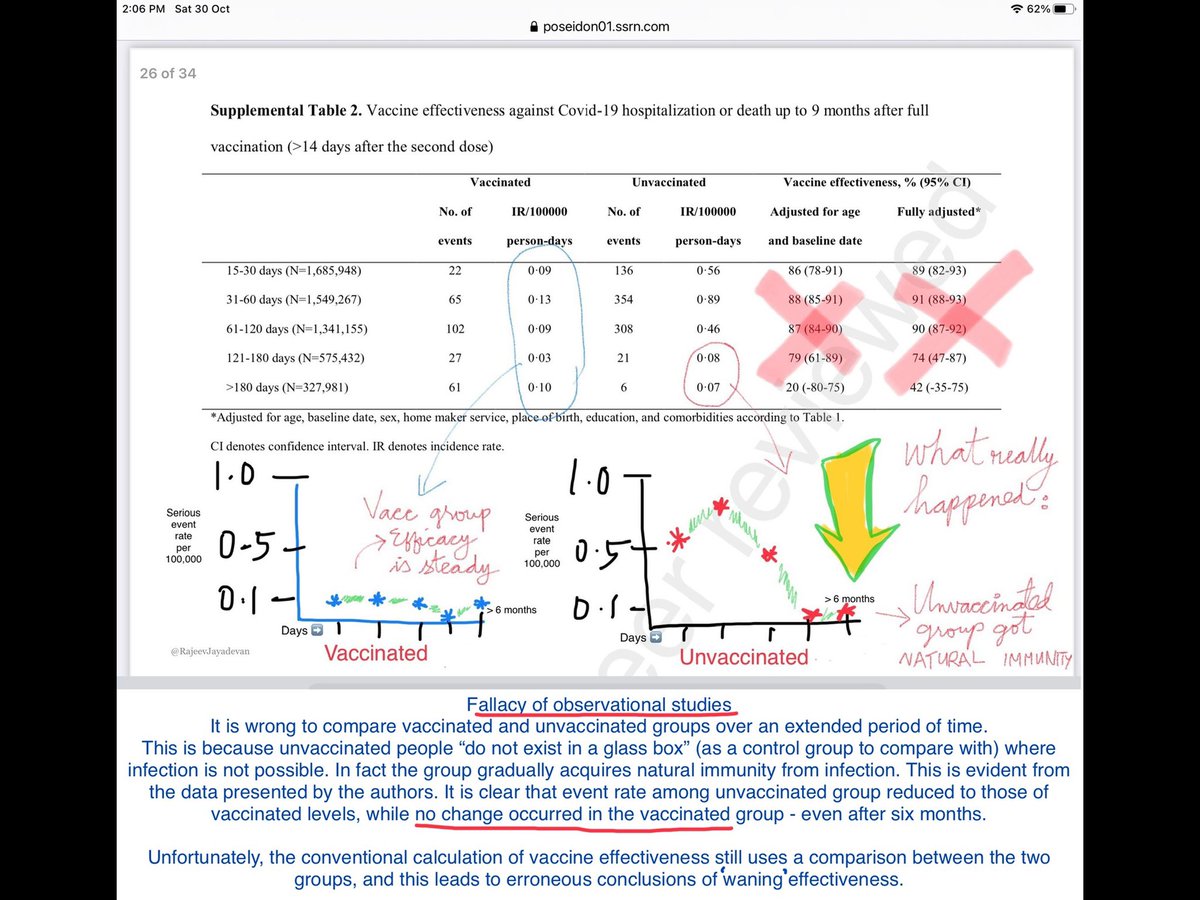
Vaccine effectiveness DOES NOT decline even after 6 months

Study from Sweden with wrong conclusions of “waning protection” against severe & symptomatic disease (see my annotations on the table)

Also illustrates the fallacy of observational studies

1/16

papers.ssrn.com/sol3/papers.cf…
The study looked at vaccinated and and vaccinated people in Sweden and looked at the event rates up to 9 months.

They calculated vaccine effectiveness at regular intervals until past six months. The authors conclude erroneously that vaccine effectiveness drops to (zero).

2/
The traditional method of calculating effectiveness is to compare the outcomes in the vaccinated & vaccinated groups and see the percentage difference between the two.

Eg. If 10 events happen in the unvax group and only 1 event occurs in the vax group, effectiveness is 90%.

3/
Read 21 tweets
29 Oct
Breakthrough infections “naturally boost” immune response.

First detailed description of immune response following breakthrough infections. This is a study on a subset of 35 people (infected vs uninfected) from the Provincetown Massachusetts outbreak, US.

See thread 👇

1/
The study compared 14 fully vaccinated individuals who got symptomatic COVID-19.

They were compared to 21 fully vaccinated individuals who were not infected during this outbreak.

469 individuals were infected in the outbreak that occurred in July.

2/
Details of the outbreak: Among the 469 people who were infected, 3/4 were fully vaccinated.

Five people were hospitalised, four of whom were fully vaccinated.

There were no deaths.

See earlier tweet for details, Will link below.

Main findings from this study👇

3/
Read 9 tweets
10 Oct
Vaccinated people have higher infection rates than unvaccinated - among all age groups over 30.

This is data from Public Health England. Rate is per 100,000.

Original graphs from PHE attached, reference link on thread.

Thanks @tlowdon

1/5
At the same time, vaccinated individuals are less likely to be admitted to hospital, or die from COVID-19.

The reported death protection is likely to be an underestimation, because vaccination preferentially occurs among people who have more background illnesses.

2/
The question is why the rate of infection is higher among vaccinated people.

It is obvious by now that vaccines aren’t very good at stopping the virus from entering the nose or throat, particularly past the initial few weeks of high antibody titres.

3/
Read 7 tweets
10 Oct
Comparison of immune response of vaccination with natural infection

1. Memory cells remains stable in number over the first 5 to 6 months in both groups

2. Memory cells continue to evolve with increased somatic mutation & emergence of unique clones

1/

nature.com/articles/s4158…
3. After natural infection, neutralising breath of memory antibodies increases with time, not much increase noted in the vaccine group.

4. We do not know yet if a third dose (or breakthrough infection) after 2-dose vaccination will generate more memory B cells

2/
5. In both groups (natural infection & vaccine), affinity maturation increased 3-7.5 fold at 5-6 months.

6. In the vaccine group, affinity increased 4.5 fold, while in natural infection it increased 11.2 fold at 5-6 months

3/
Read 9 tweets

Did Thread Reader help you today?

Support us! We are indie developers!


This site is made by just two indie developers on a laptop doing marketing, support and development! Read more about the story.

Become a Premium Member ($3/month or $30/year) and get exclusive features!

Become Premium

Too expensive? Make a small donation by buying us coffee ($5) or help with server cost ($10)

Donate via Paypal

Thank you for your support!

Follow Us on Twitter!

:(