I'm all for understanding why and how trades don't go as you planned them.
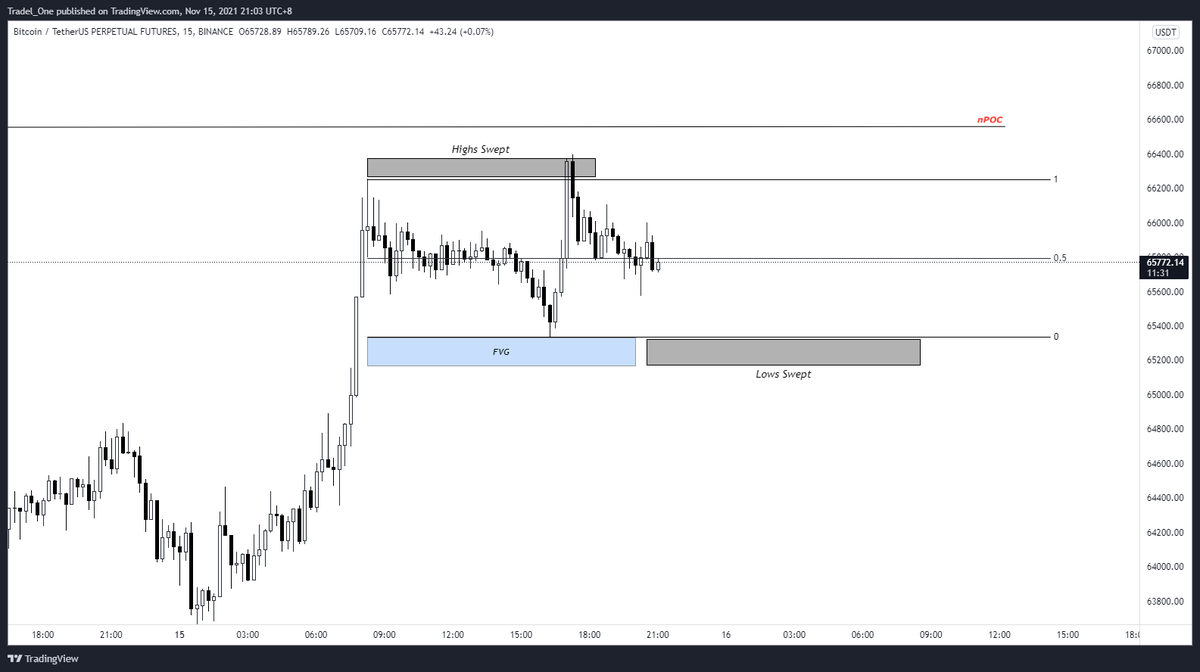
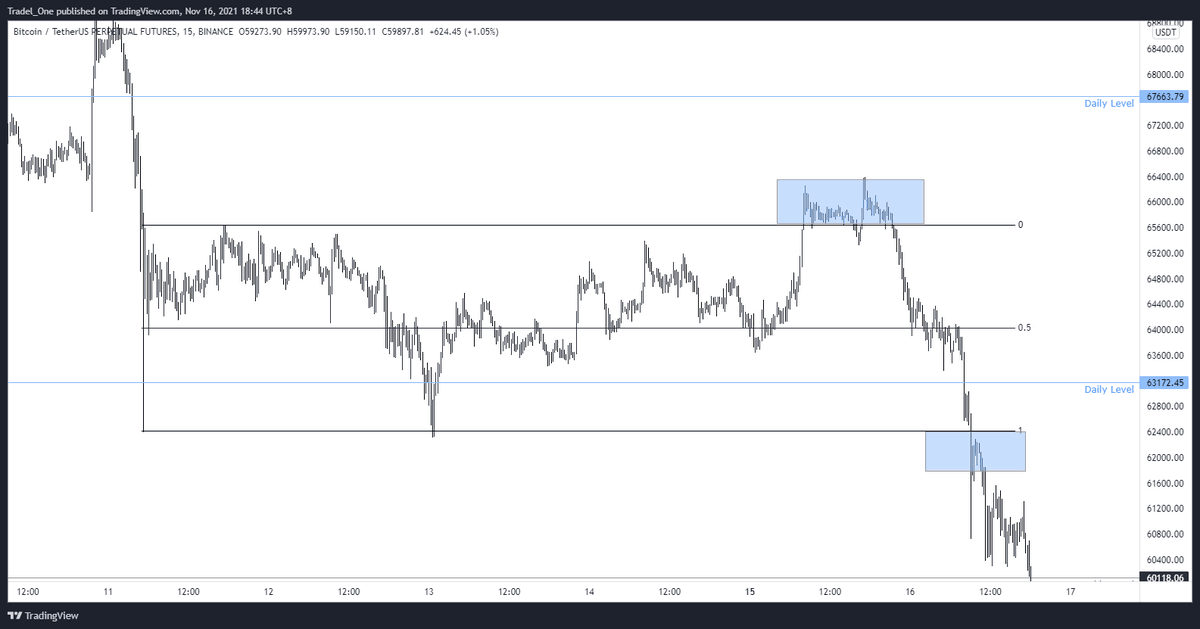
So let's take a look at $BTC, where I thought we would tap the nPOC and 0.618 level at least before any further move up or down from there.
I hope this can help you with your own trading!
So let's take a look at $BTC, where I thought we would tap the nPOC and 0.618 level at least before any further move up or down from there.
I hope this can help you with your own trading!

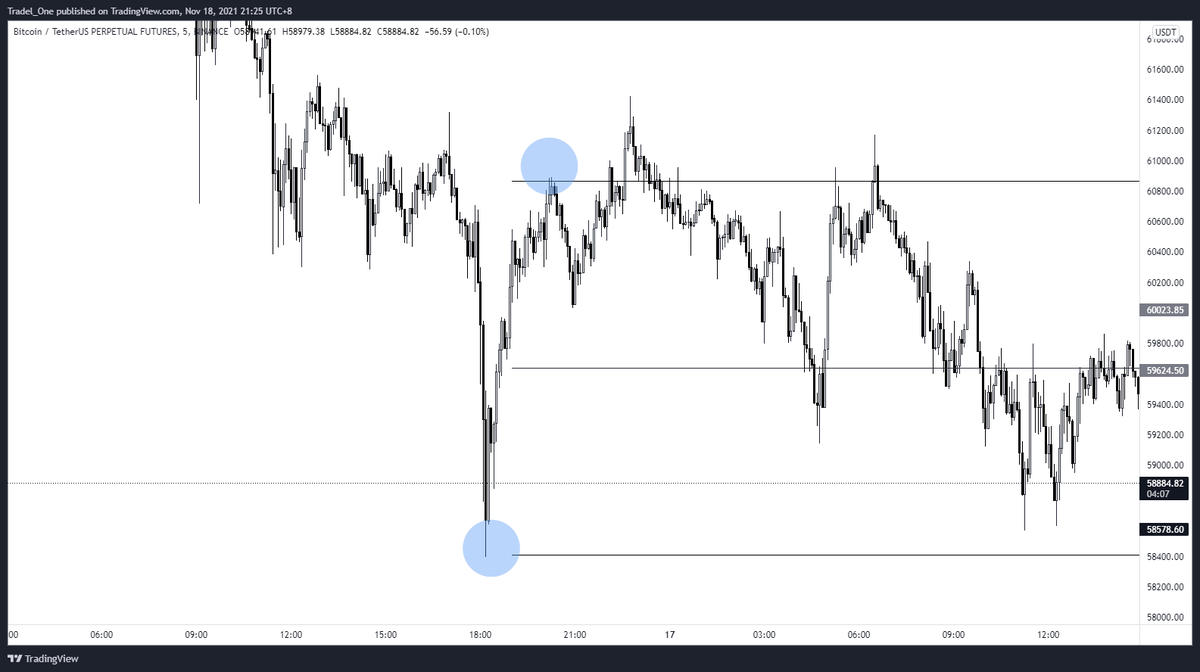
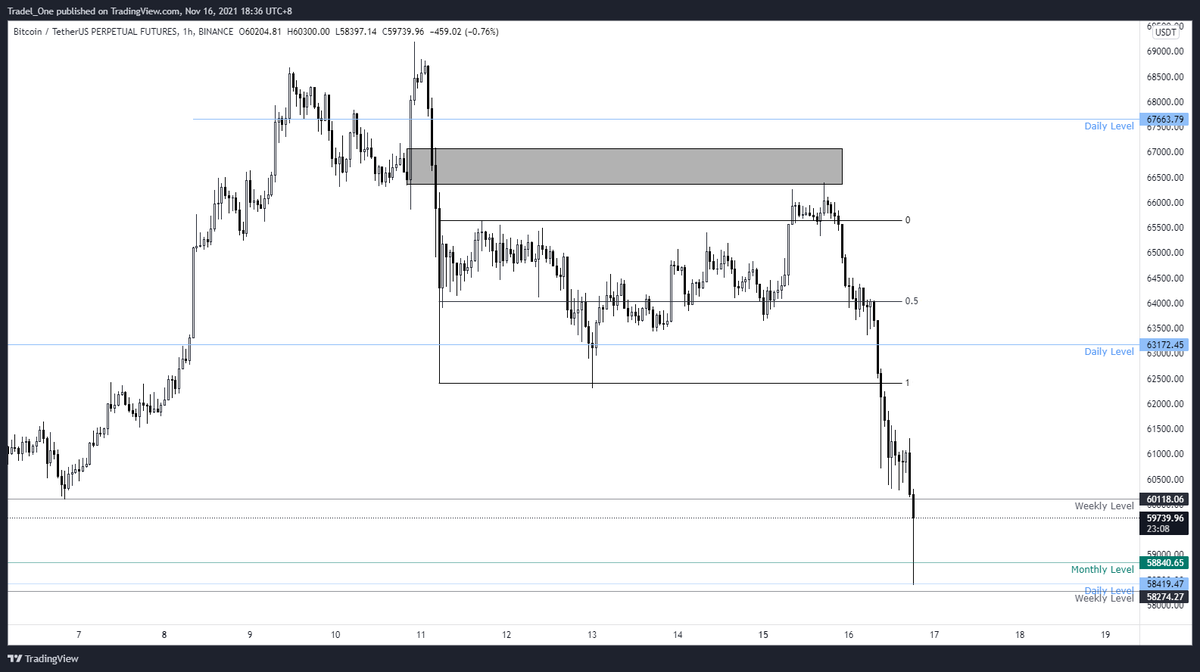
First of all, we had a LTF range that was drawn at the top of the MTF range
Remember how the nPOC and 0.618 fib level were just resting above this zone?
When breaking down the price action, it was clear in hindsight that one of @RektProof's MTF plays were in effect
Remember how the nPOC and 0.618 fib level were just resting above this zone?
When breaking down the price action, it was clear in hindsight that one of @RektProof's MTF plays were in effect


In terms of resistance, you can see that the previous bullish orderblock becomes resistance
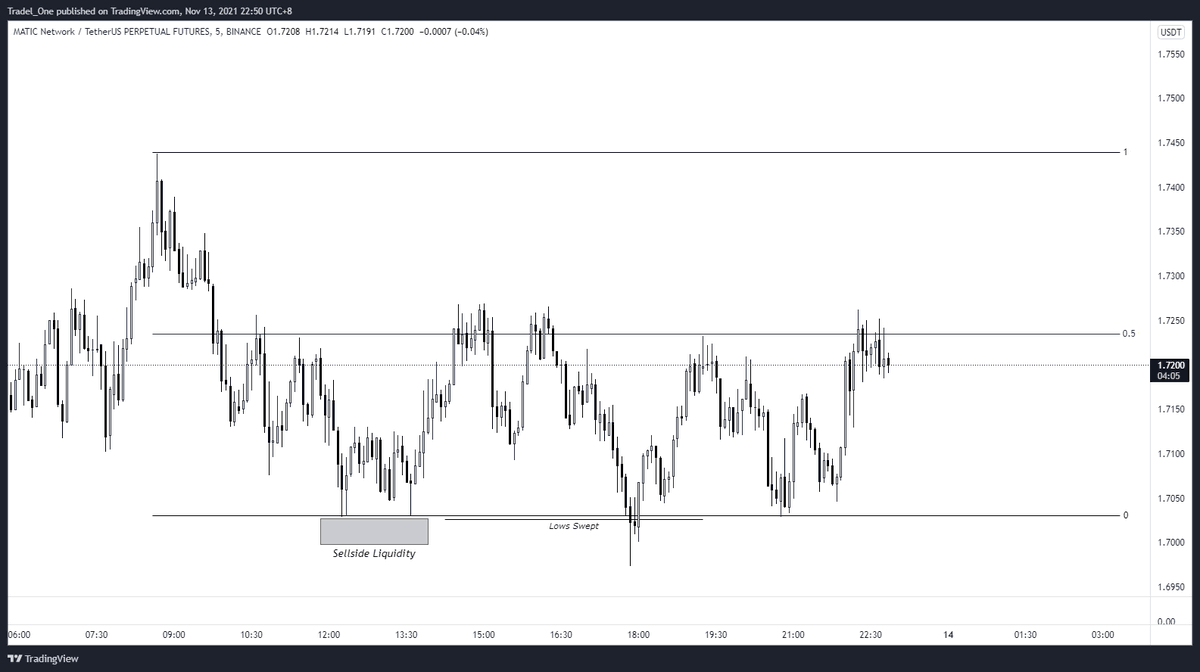
Another way to view this if you are having trouble visualising bearish set ups is to invert your chart.
Looking at the below chart, if you are currently used to bullish runs, you now have a familiar-ish setting at the click of a button
Looking at the below chart, if you are currently used to bullish runs, you now have a familiar-ish setting at the click of a button

So conclusion?
I didn't zoom out enough to see the play that had happened. The liquidity had been taken from range high for a run to range low (and lower), but I was focused on the typical nPOC and 0.618 level first.
All good though - got to debrief & continue to grow!
I didn't zoom out enough to see the play that had happened. The liquidity had been taken from range high for a run to range low (and lower), but I was focused on the typical nPOC and 0.618 level first.
All good though - got to debrief & continue to grow!
And lastly guys, you know that I'm partnered with @Delta_Exchange - they are a great team, & superb to work with
If you're keen to go and trade there, feel free to use the below link: delta.exchange/MindsetBTC
Thanks as always - hope you picked something up from this!
If you're keen to go and trade there, feel free to use the below link: delta.exchange/MindsetBTC
Thanks as always - hope you picked something up from this!
• • •
Missing some Tweet in this thread? You can try to
force a refresh