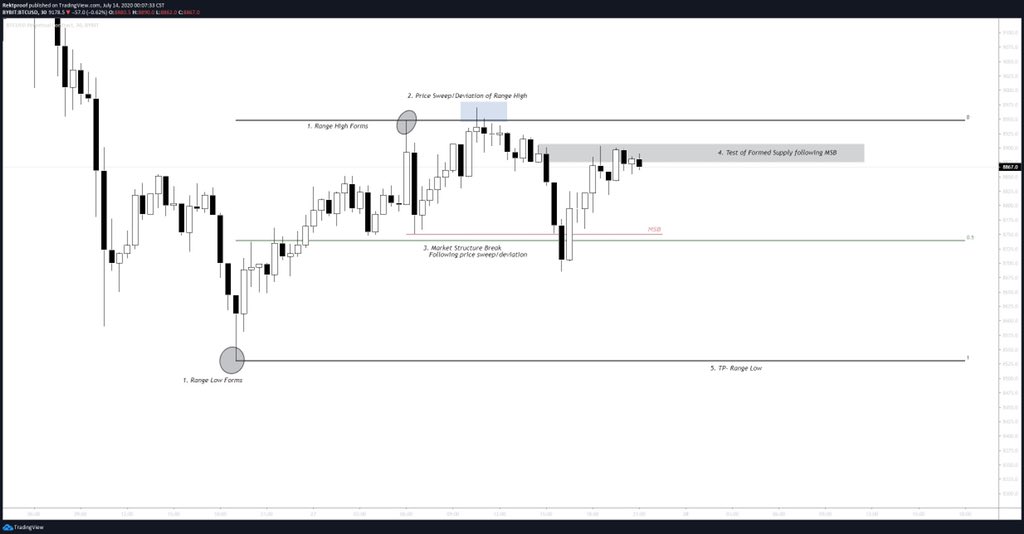
$BTC / $USD
Price approaching the 2D Demand.
Looking for something to develop around that swing low/Npoc for a relief bounce.
Slight FVG into 62-63k confluence with the current range low so looking to see if we come back to fill.
#Bitcoin
Price approaching the 2D Demand.
Looking for something to develop around that swing low/Npoc for a relief bounce.
Slight FVG into 62-63k confluence with the current range low so looking to see if we come back to fill.
#Bitcoin

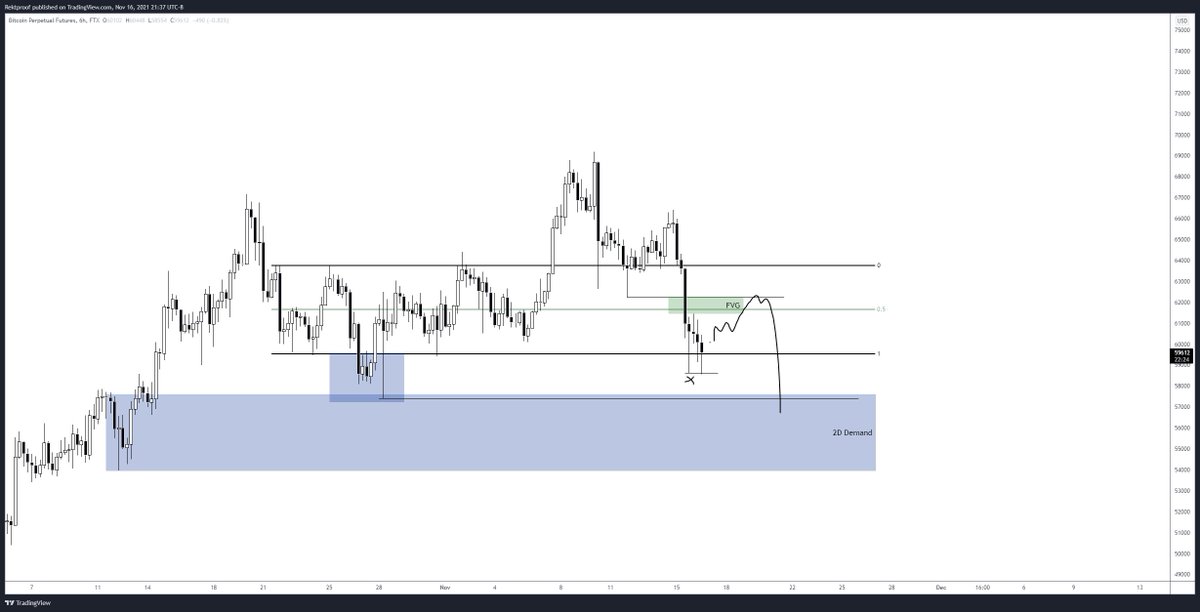
$BTC / $USD
Zoomed out a bit and noticed we are back at the range low of an old range.
Still marking out that FVG above incase we decide to fill before making another low.
HTF and LTF charts below.
#Bitcoin
Zoomed out a bit and noticed we are back at the range low of an old range.
Still marking out that FVG above incase we decide to fill before making another low.
HTF and LTF charts below.
#Bitcoin

$BTC / $USD
Only hopium I can offer.
Price finally tagged this 2D Demand ideally would want us to take out that NPOC deeper into demand with a deviation set below range low before a potential PO3 plays out..
Letting it develop.
#Bitcoin
Only hopium I can offer.
Price finally tagged this 2D Demand ideally would want us to take out that NPOC deeper into demand with a deviation set below range low before a potential PO3 plays out..
Letting it develop.
#Bitcoin

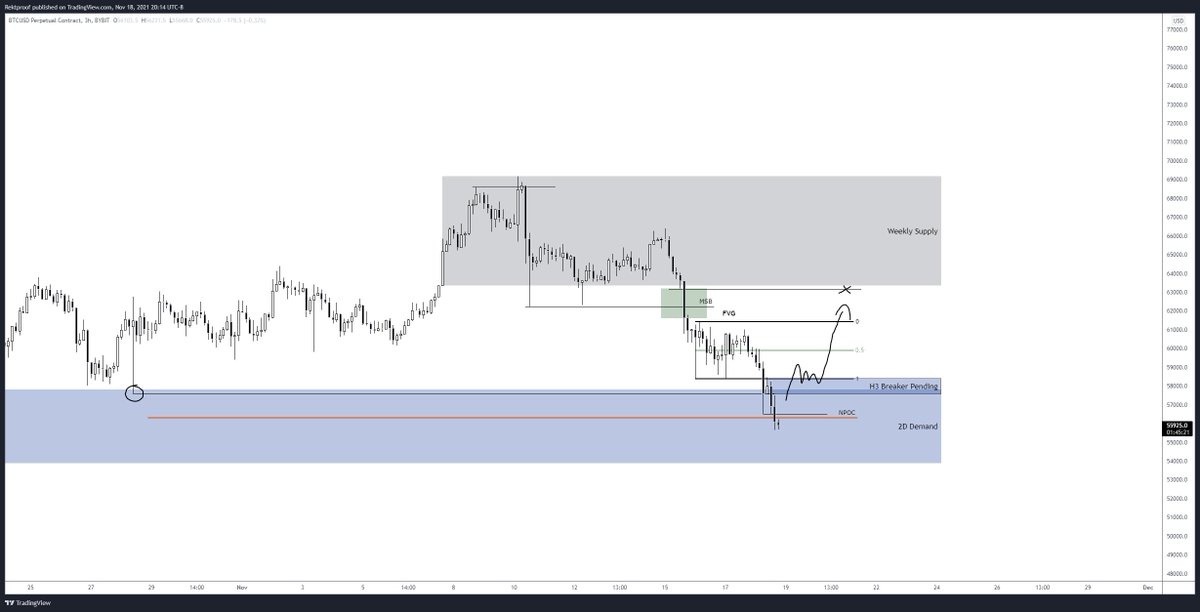
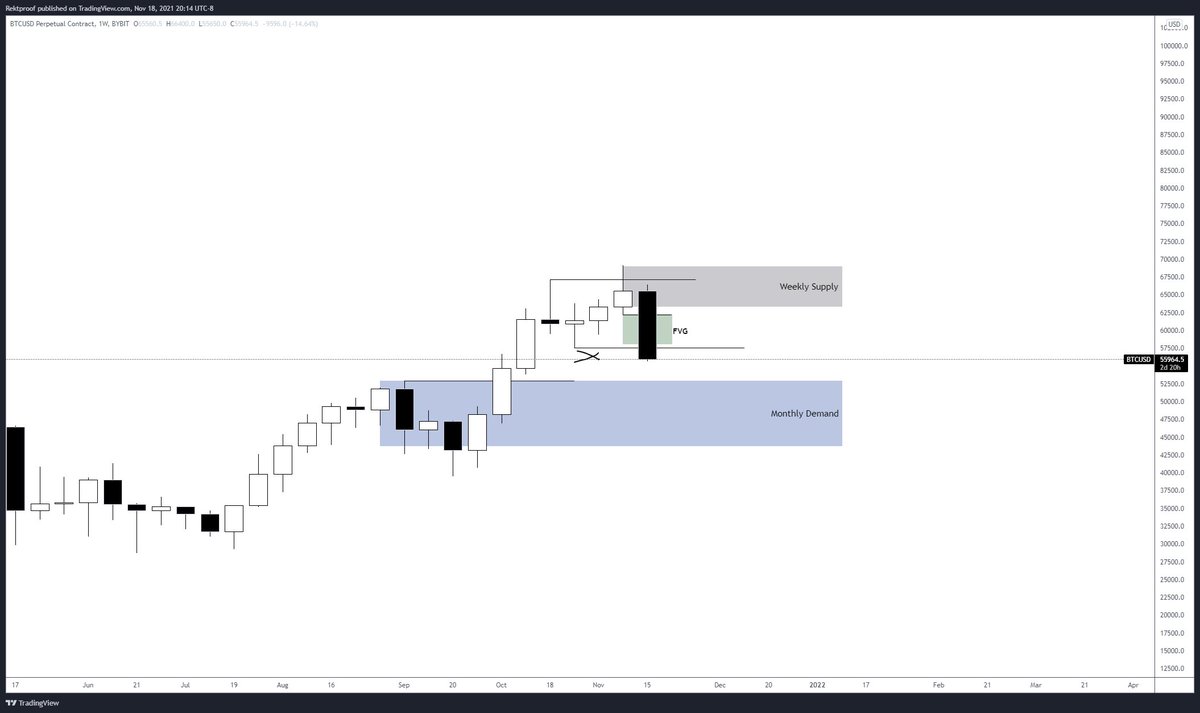
$BTC / $USD
Finally took out the NPOC into demand.
Potential H3 breaker to form if we get back above also looks like we have a weekly supply forming so that will be the target for next weeks PA.
Might start scaling into Alts this weekend going into next week.
#Bitcoin
Finally took out the NPOC into demand.
Potential H3 breaker to form if we get back above also looks like we have a weekly supply forming so that will be the target for next weeks PA.
Might start scaling into Alts this weekend going into next week.
#Bitcoin
• • •
Missing some Tweet in this thread? You can try to
force a refresh