#PriceAction
Broken Swing Points
Wanted to briefly cover instances when I see traders get trapped within different variations as price consolidates and breaks down and how to potentially avoid.
Small write up to cover:
- Broken Swing Points
- Potential Entries
- Conclusion
Broken Swing Points
Wanted to briefly cover instances when I see traders get trapped within different variations as price consolidates and breaks down and how to potentially avoid.
Small write up to cover:
- Broken Swing Points
- Potential Entries
- Conclusion

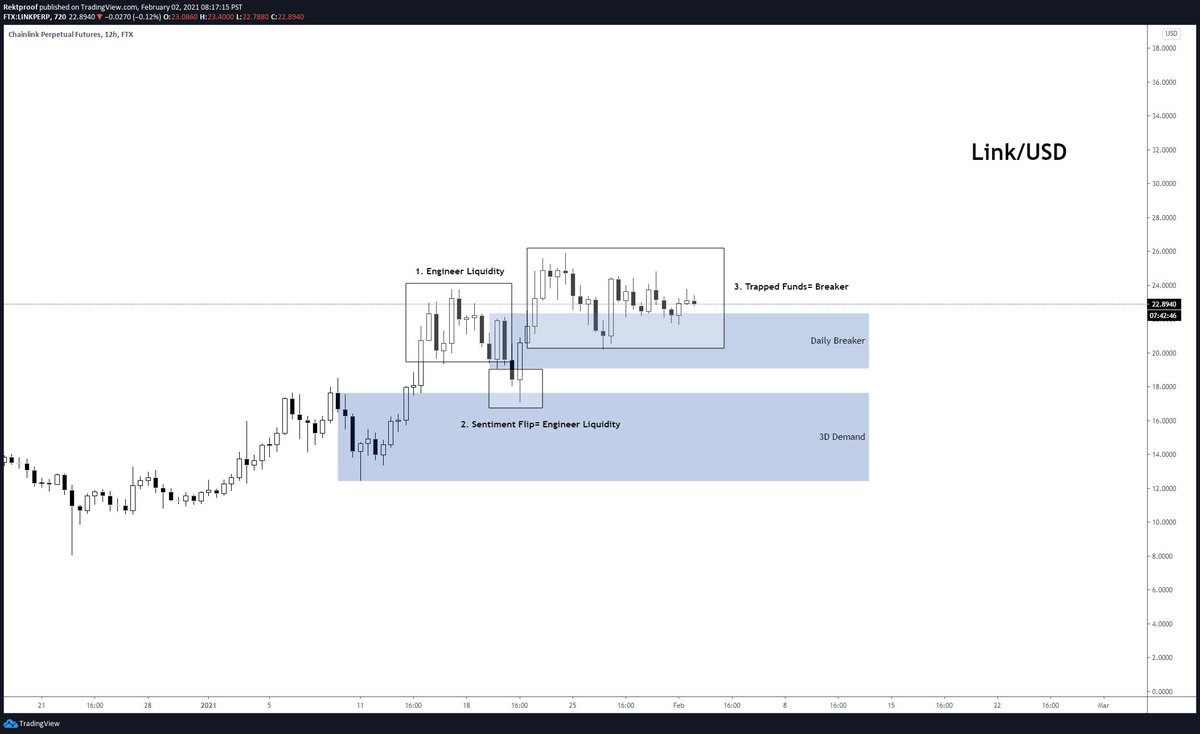
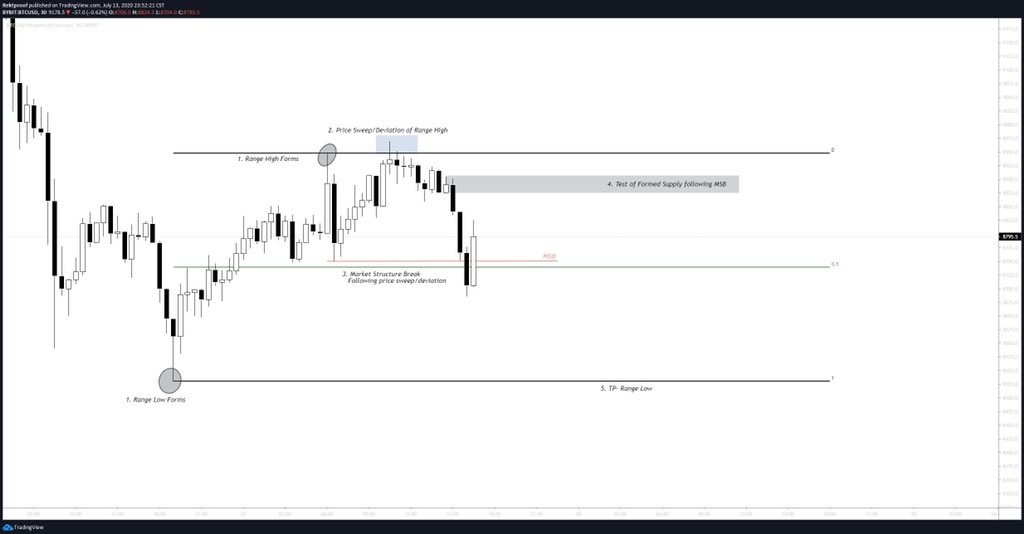
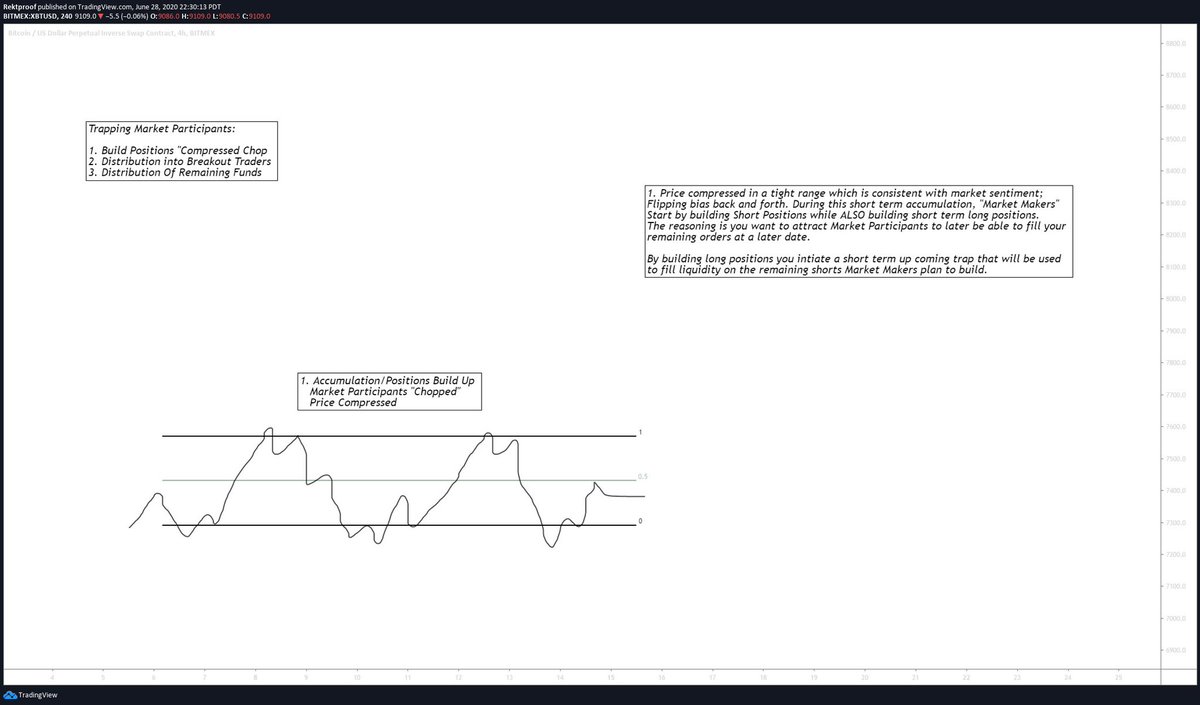
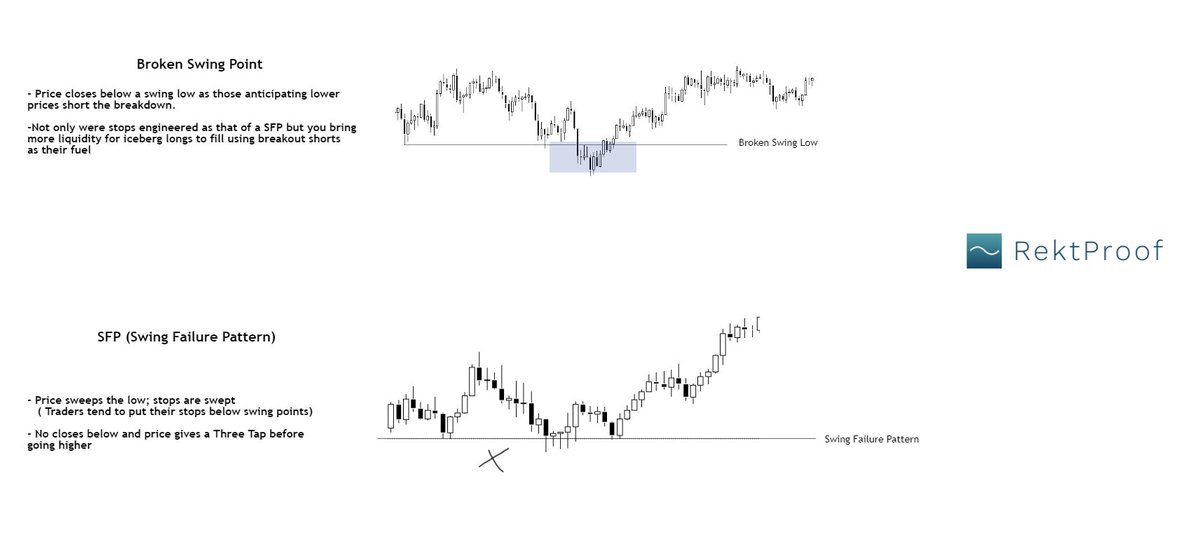
Broken swing points vs SFP's
We know the standard SFP-
Price sweeps a level and reverts to the opposing side.
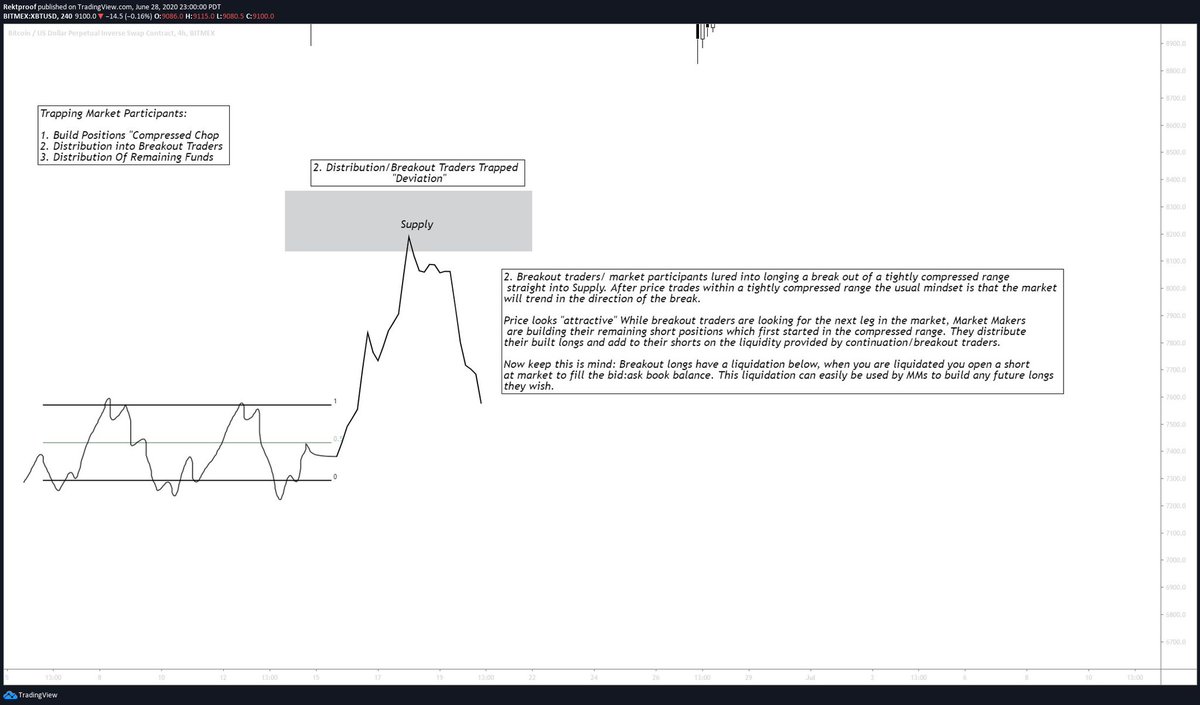
What If we fail to sweep but close below an SFP?
This is when breakout traders come in and are trapped hence the manipulation cycle.
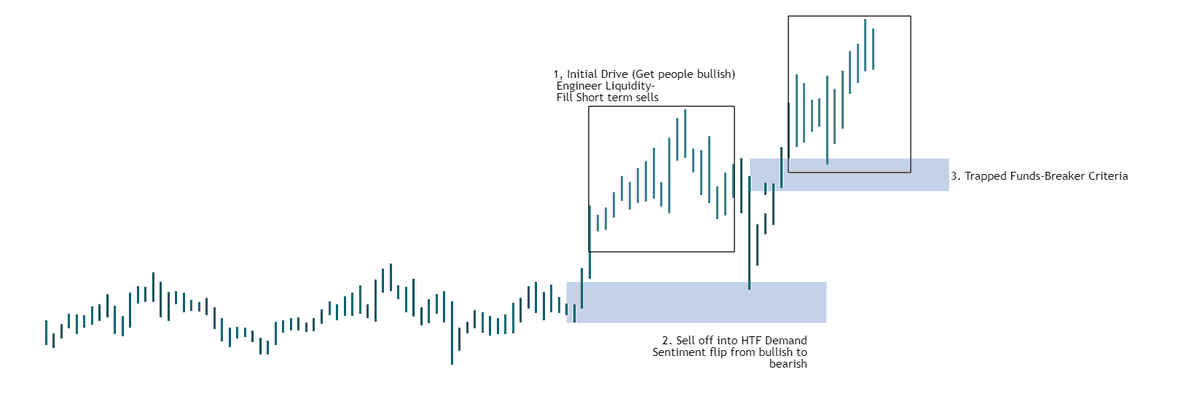
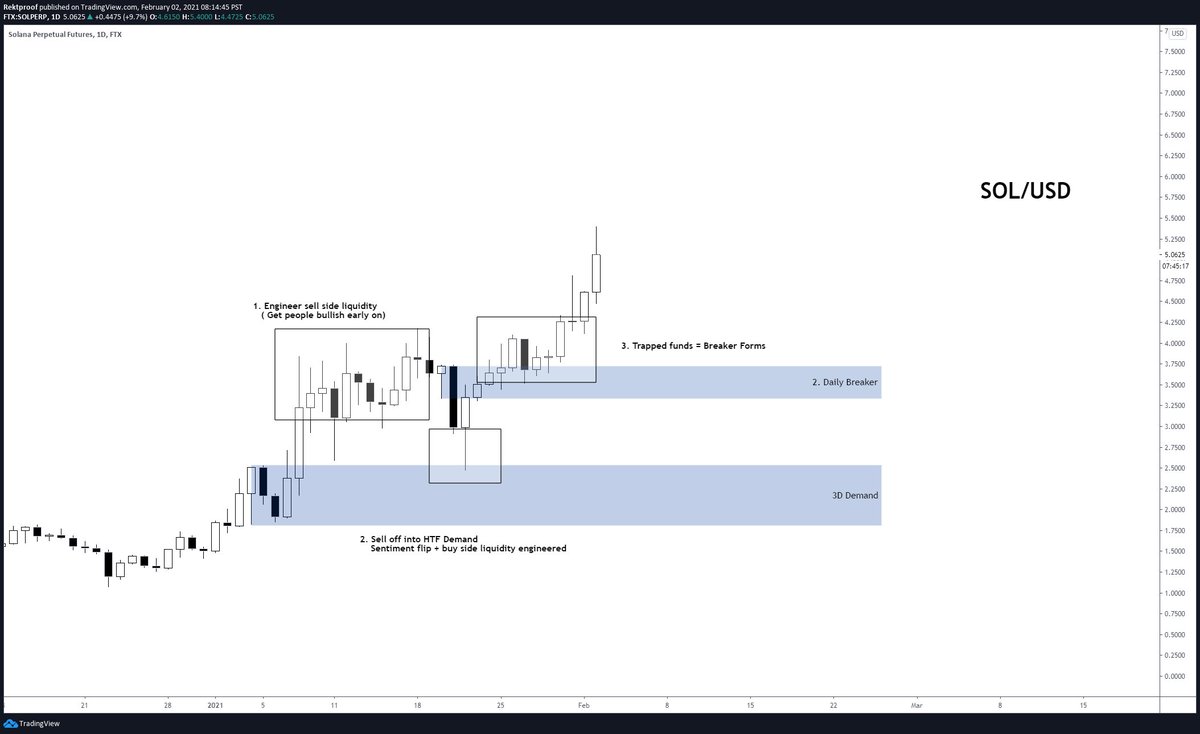
Notes on the Diagram Chart:
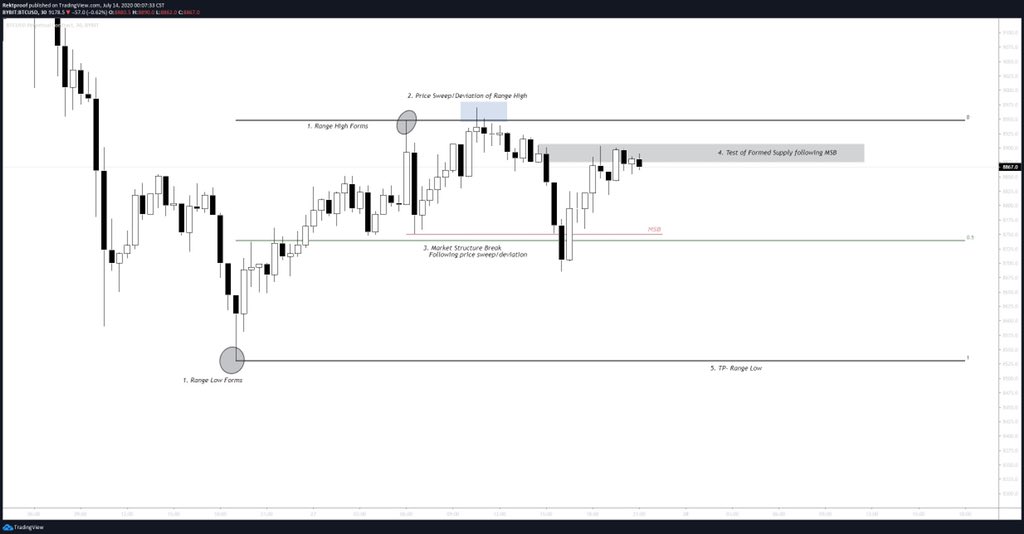
We know the standard SFP-
Price sweeps a level and reverts to the opposing side.
What If we fail to sweep but close below an SFP?
This is when breakout traders come in and are trapped hence the manipulation cycle.
Notes on the Diagram Chart:
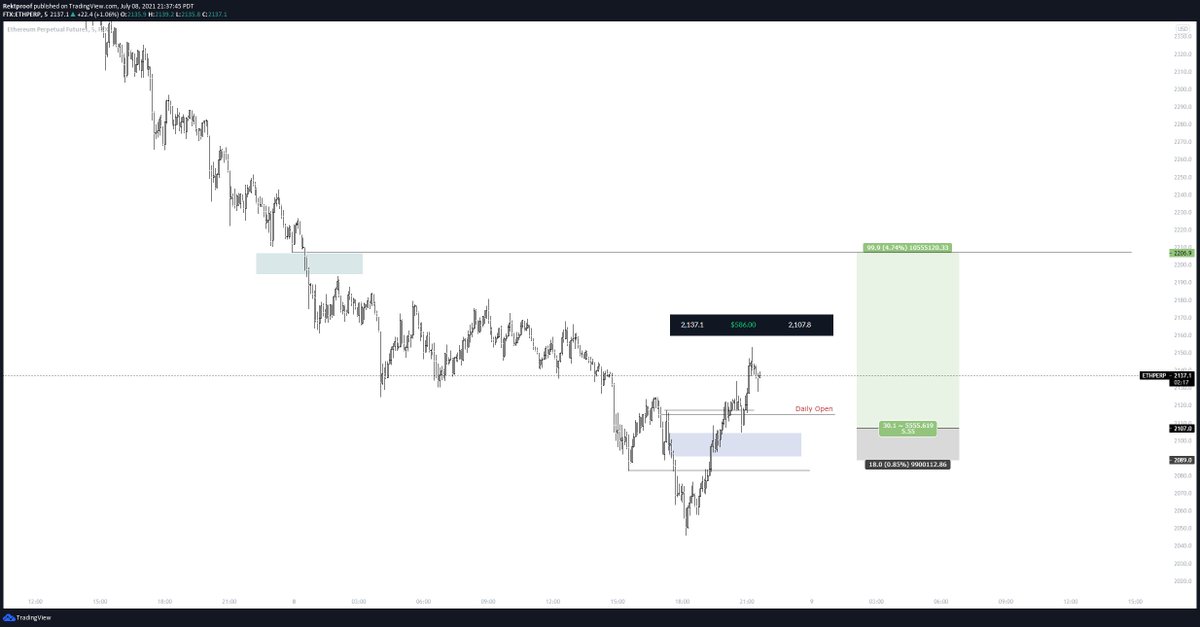
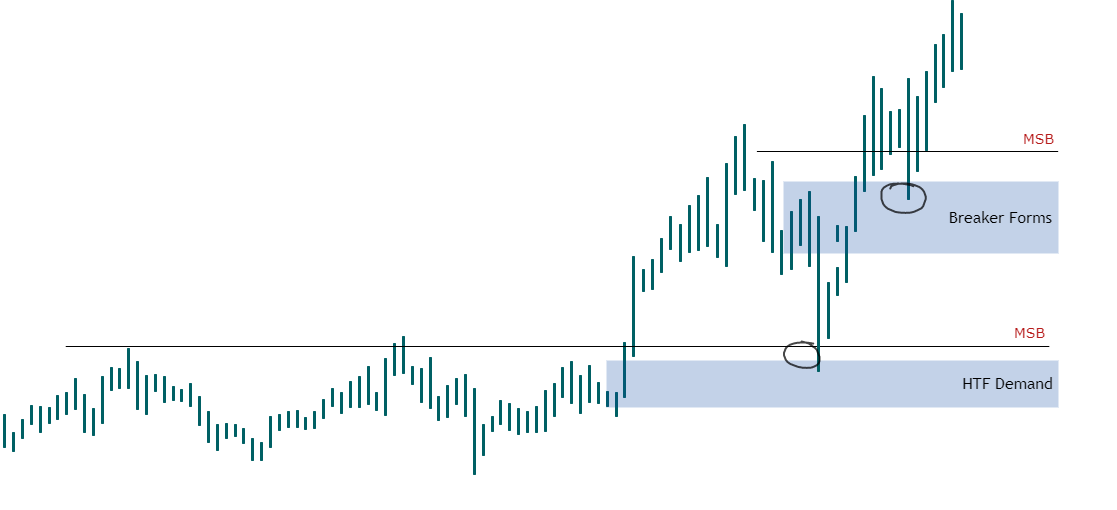
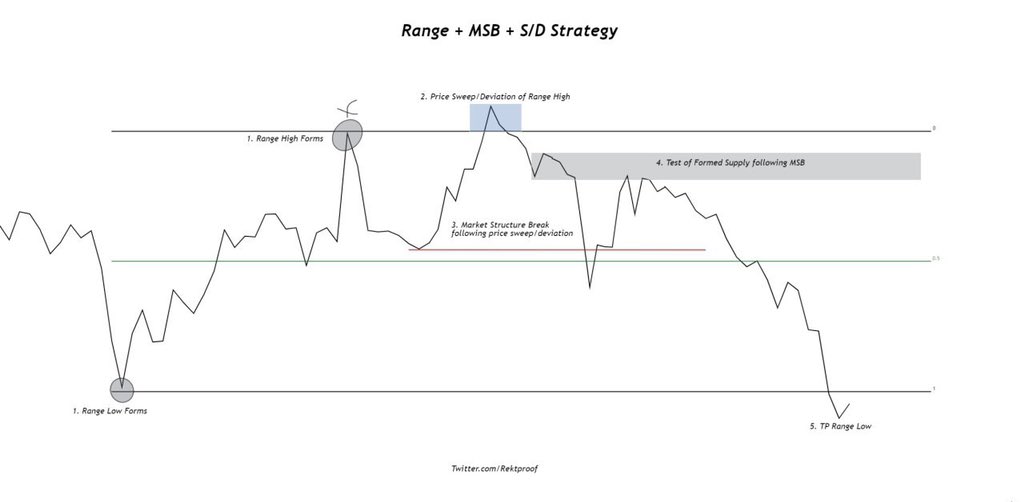
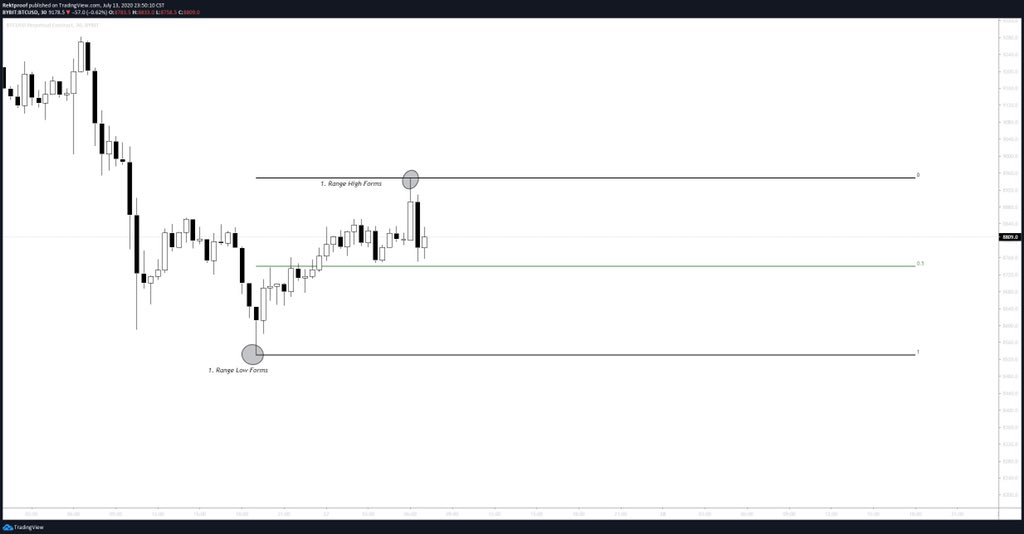
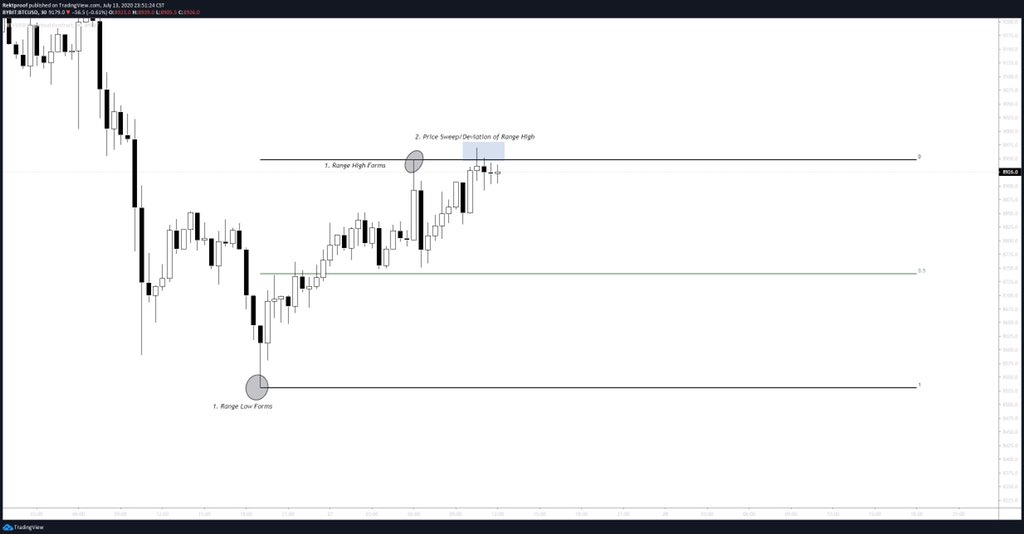
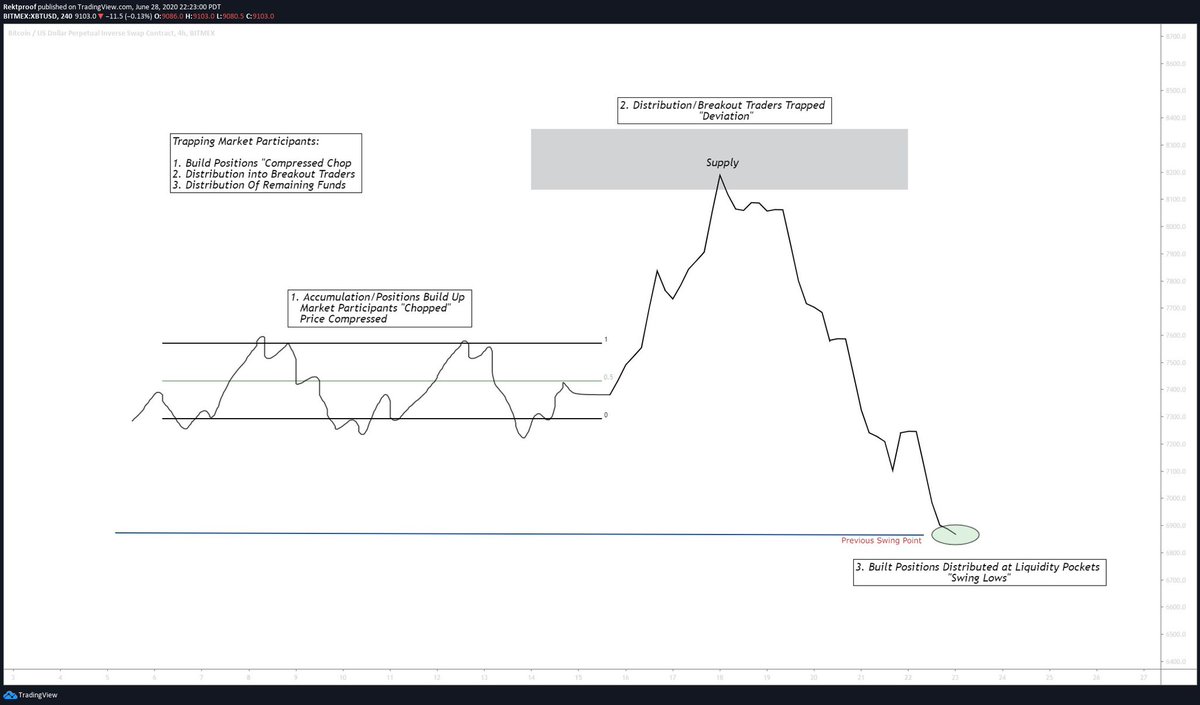
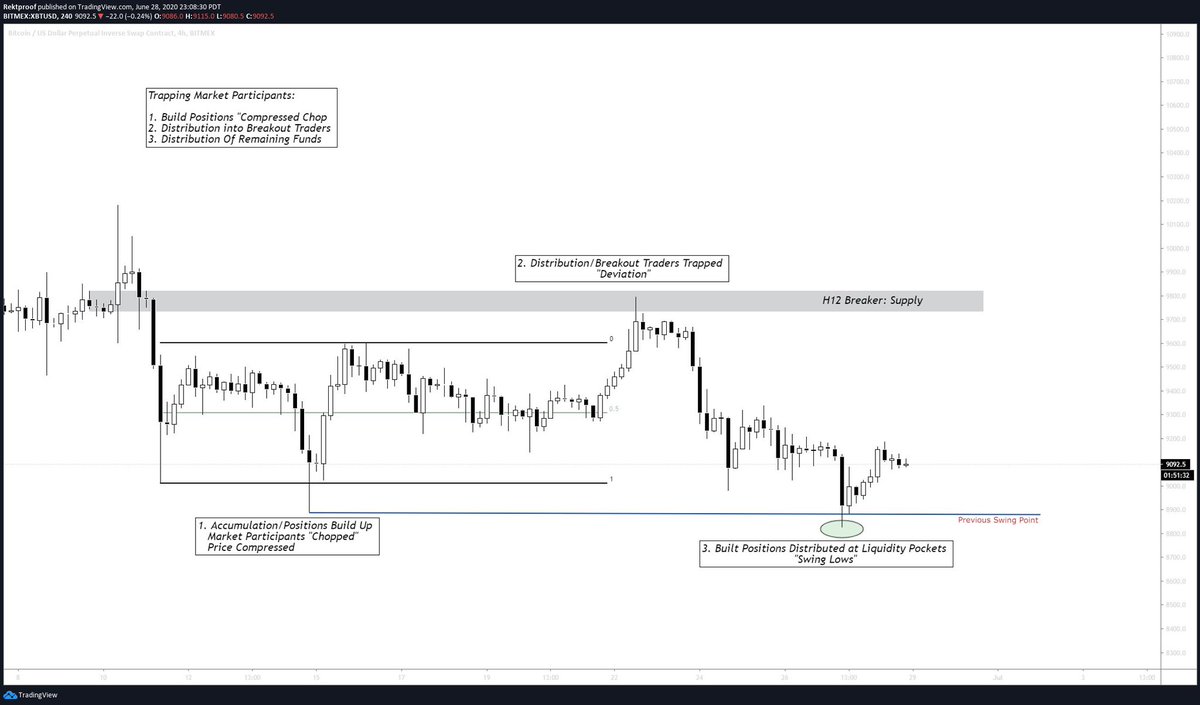
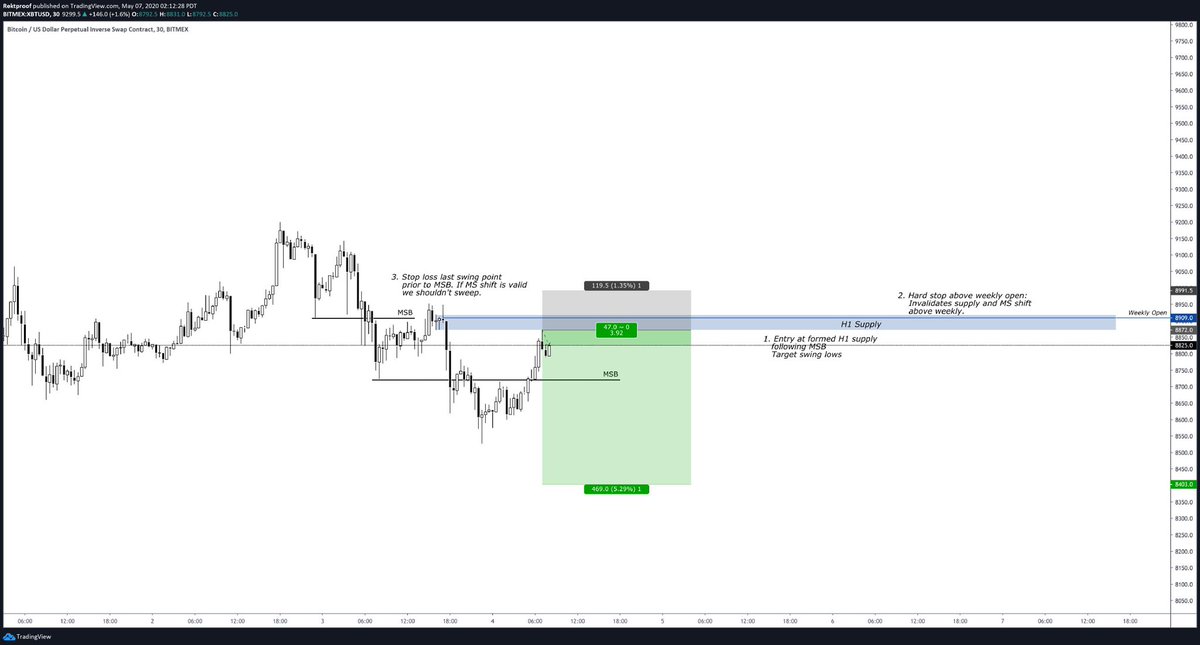
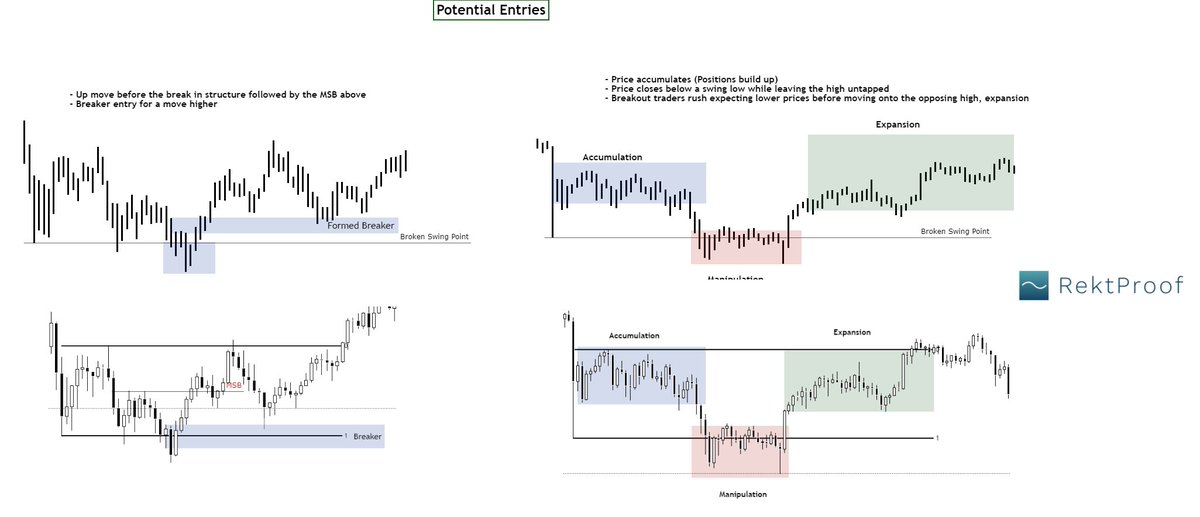
Potential Entries:
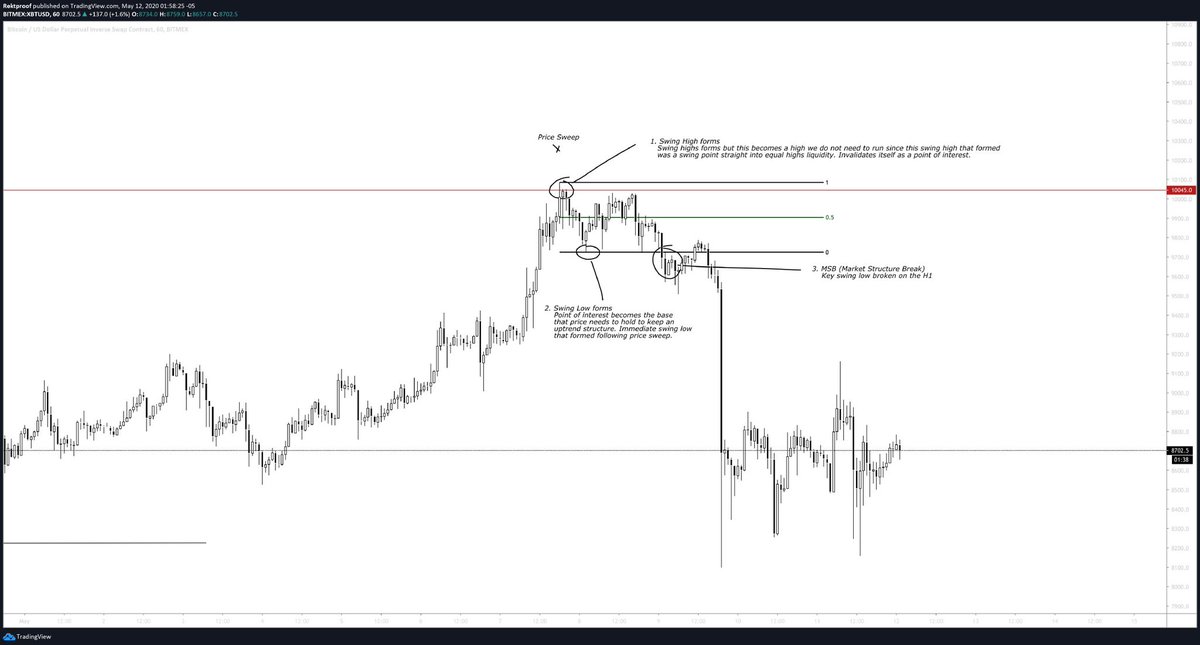
PO3's play a vital role when price breaks a key swing point. As long as we leave an opposing high any close below is a high probability we trap first and then go for the high second
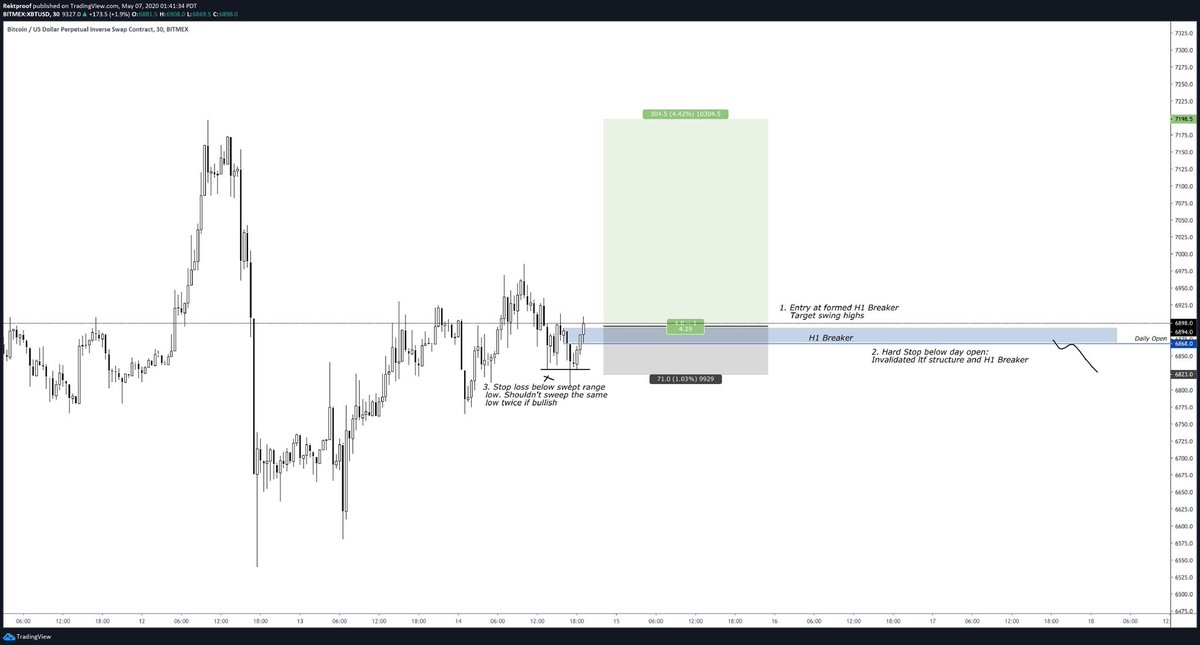
Breakers offer good entry points for a broken low once we shift above
PO3's play a vital role when price breaks a key swing point. As long as we leave an opposing high any close below is a high probability we trap first and then go for the high second
Breakers offer good entry points for a broken low once we shift above
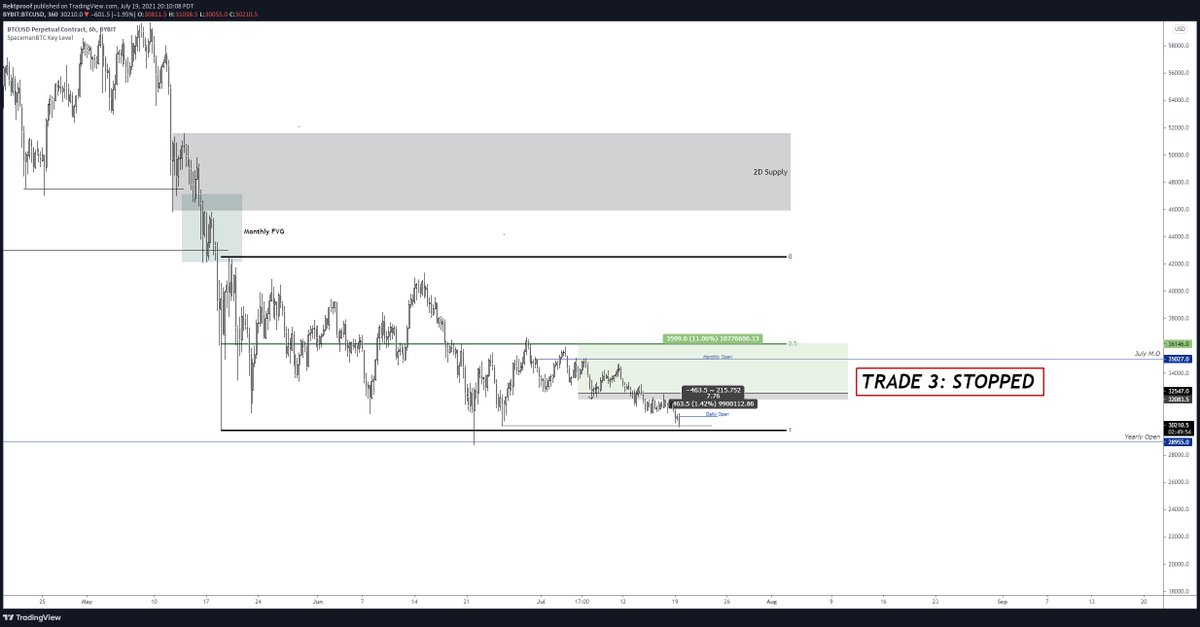
Conclusion:
Acting out of impulse anticipating certain movements will only leave you tied into a position that you didn't have a gameplan for.
Ask yourself why we are breaking down, if we left any opposing ends that might potentially trap retail traders.
Use logic.
End..//
Acting out of impulse anticipating certain movements will only leave you tied into a position that you didn't have a gameplan for.
Ask yourself why we are breaking down, if we left any opposing ends that might potentially trap retail traders.
Use logic.
End..//
• • •
Missing some Tweet in this thread? You can try to
force a refresh