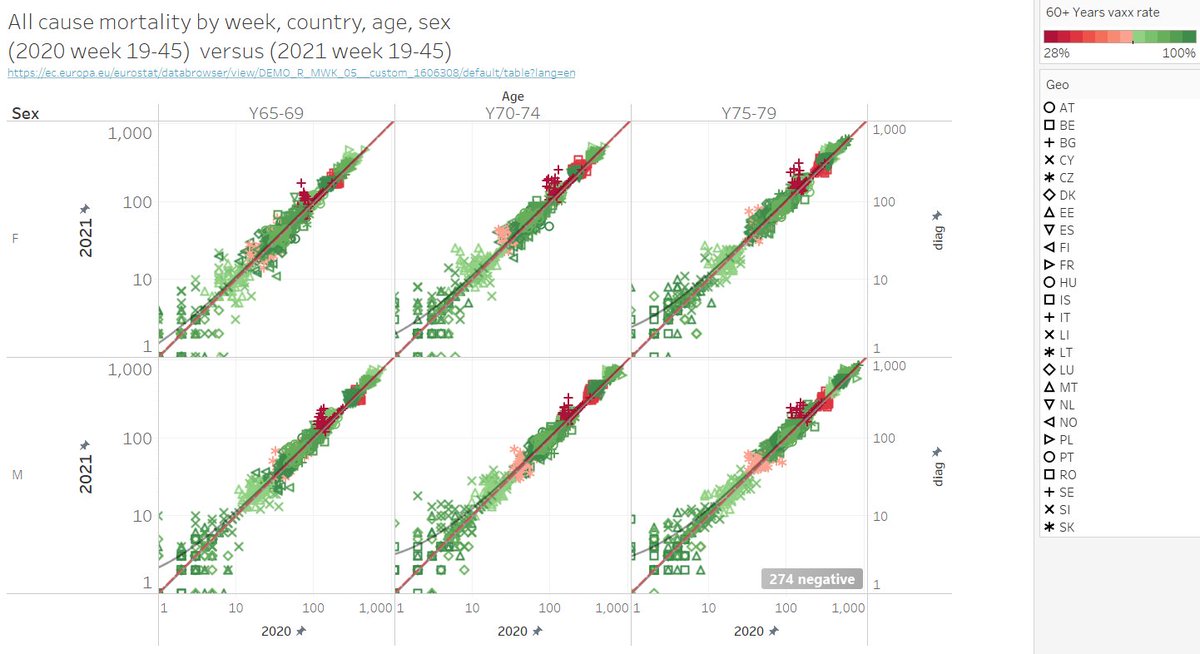
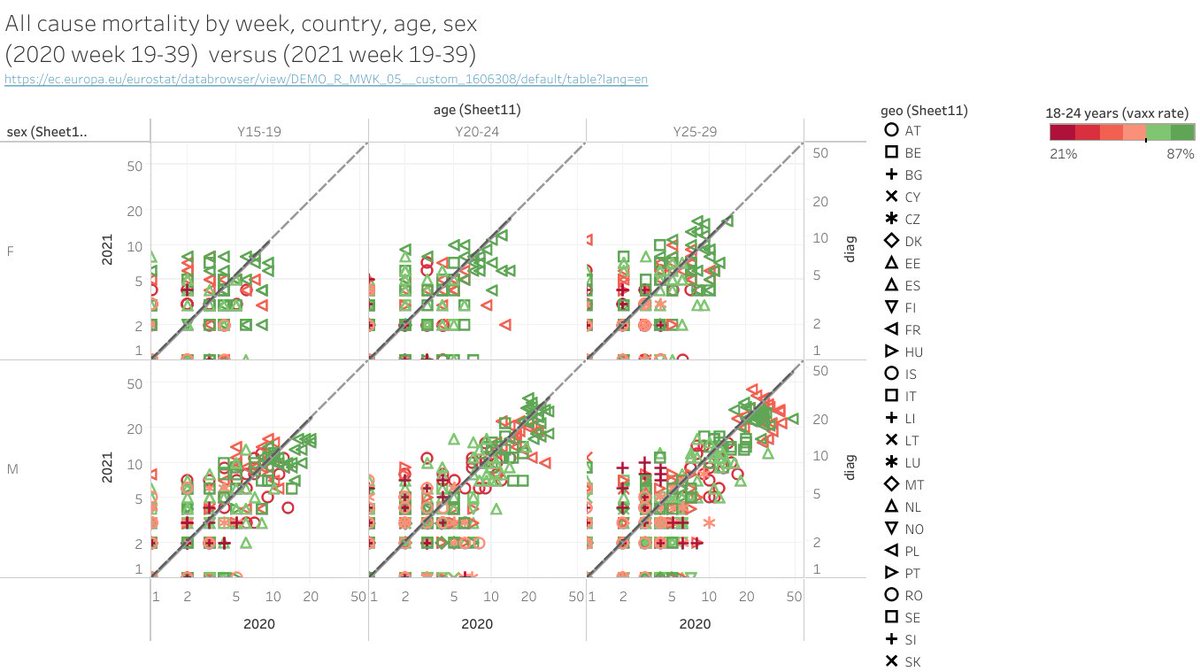
Here a challenge: This is the map for vaxx rate 18-24 years. Now, I have not looked to all cause yet. What do we expect to see?

A) noise and lockdown effects
B) we will see the broken boys hearts
C) vaxx rate reversely correlates with mortality

PS: the DE number is estimated.
Place your bets, @jens_140081
@jens_140081 You are B biased? Yes, we have all seen this video last year๐Ÿ˜ƒ

I go with A. We will see.

They can't handle 2M lines? Well well๐Ÿ˜…

#MA2412

โ€ข โ€ข โ€ข

Missing some Tweet in this thread? You can try to force a refresh
ใ€€

Keep Current with Orwell2024

Orwell2024 Profile picture

Stay in touch and get notified when new unrolls are available from this author!

Read all threads

This Thread may be Removed Anytime!

PDF

Twitter may remove this content at anytime! Save it as PDF for later use!

Try unrolling a thread yourself!

how to unroll video
  1. Follow @ThreadReaderApp to mention us!

  2. From a Twitter thread mention us with a keyword "unroll"
@threadreaderapp unroll

Practice here first or read more on our help page!

More from @orwell2022

24 Nov
1/ Yesterday we had a poll on mortality vs. vaxx rate for the young (15y-29y).

Result (data): no obvious correlation. Not even for the 20-24 year old males, the group with the known (mRNA) myocarditis risk. See e.g. the map.

Today: The elderly (65+). But first a poll ๐Ÿ˜€
2/ So for the above 65 years olds (where vaxxing is claimed being the most urgent thing apparently), what are your expectations?

Results are ready, but let's give you some time to reflect๐Ÿ˜€

@jens_140081 @mr_Smith_Econ @OS51388957 @connolly_s @SHomburg @USMortality
3/ Like yesterday:

first the EC all cause mortality raw data 2020 vs. 2021 (no aggregation: each point is one week).

age: (left) 65-69, (mid) 70-74, (right) 75-79
males (bottom), females (top)
colour by vaxx rate 65+, symbol by country

Pretty diagonal. No๐Ÿ’‰ correlation. ๐Ÿง
Read 22 tweets
23 Nov
First: raw data correlation 2020 vs. 2021.

left: lin-lin
right: log-log
symbol: country
Colour: vaxx rate (%) for the 18-24 age
each point is one week

Looks ok now. So let's aggregate.
We sum mortality of weeks 19-39 for 2020 and 2021.

Then plot SUM(2020 W19:W39) vs. SUM(2021 W19:W39) by age, sex.

symbol: country
colour: vaxx rate (%) for the 18-24 age

Diagonal (with some excursion), as expected.

Now let's do more and define an "excess".
Now let's define a "2021 excess" as

SUM(mortality 2021 W19:39) - SUM(mortality 2020 W19:39)

We now plot excess vs vaxx rate by country, age, sex.

Finally: the correct answer was
A โœ…
B โŒ
C โŒ
I cannot see any correlation.
Read 7 tweets
12 Nov
1/ What is wrong in NL?

so many lockdowns
so many test for entry
so many school closures
so mutch fear
masking 1.5 years
teleworking 1.5 years
alcohol bans
months of curfew
police beating demonstrators
QR fundamentalism

and now this ??

Bottom figures: panic why? Image
2/ NL will now punish the unvaxxed with 2G to protect them.

Those are mainly below 35. The healthy young future of NL. Do you see how they need to be protected? Image
3/ Therefore the young and children need to "urgently" be vaccinated, although this data should make you wonder why. ImageImage
Read 13 tweets
6 Nov
1/ #oversterfte Netherlands: The observed mortality rates from EMA Pharmacovigilance (C19 vax) look bad, but in a range that shouldn't show up in the total mortality. It would be a disaster if it did.

What we need are mortality rates by cause and age (e.g. cardiac...).
2/ NL 15-19 years: nothing to see, except MH17 incident 2014.
3/ NL 20-24 years: nothing to see here, except MH17 incident 2014.
Read 19 tweets
2 Nov
1/ NL hospital admission data aggregation on the young cohorts.

1) There is only 1 ICU admission in the 0-14 year bin. (in Q4 is not, shown here). Amazing healthy.

2) We do see a significant increase in numbers in 2021, in particular in Q2 / Q3. When was start of๐Ÿ’‰๐Ÿ˜‰๐Ÿ˜Œ?
2/ The dominating AE should be myocarditis in males.

In NL we have 1.6M males in the 15-29 male group.
With >50% vaccinated and assuming myocarditis rates of e.g. 1:10000 to 1:2000 we expect 80 to 400 cases, or 40 to 200 in Q2 and Q3.
3/ Is it possible to get data on admission root cause statistics from @rivm? In particular the amount of heart related issues in 15-29 old males by quater for 2021?

@mr_Smith_Econ
@dimgrr
@waukema
@PvanHouwelingen
@hugodejonge
@nos
@mauricedehond
@KoenSwinkels
@Lareb_NL
Read 5 tweets
1 Nov
1/ Expected rate of vaccinated in ICU.

(Correcting here the spotted mistake in the explanation part.)

Here is the formula explained. It depends on vaccination rate and vaccine efficiency.

The special case for 90% vaccinated is shown on the right as function of VE-ICU.
2/ For Austria and NL where 90% of the at risk group is vaccinated we expect 30%-50% of the ICU patients to be vaccinated if assuming a VE-ICU of ~90%.
3/ Let's show the results of the formula in 2D as function of

x) vaccination level
y) VE agains ICU

The resulting rate (calculation on right) of vaccinated in ICU is shown in the cell.

It can be used as look-up table to estimate (roughly) the VE.
Read 11 tweets

Did Thread Reader help you today?

Support us! We are indie developers!


This site is made by just two indie developers on a laptop doing marketing, support and development! Read more about the story.

Become a Premium Member ($3/month or $30/year) and get exclusive features!

Become Premium

Too expensive? Make a small donation by buying us coffee ($5) or help with server cost ($10)

Donate via Paypal

Thank you for your support!

Follow Us on Twitter!

:(