1/ #oversterfte Netherlands: The observed mortality rates from EMA Pharmacovigilance (C19 vax) look bad, but in a range that shouldn't show up in the total mortality. It would be a disaster if it did.

What we need are mortality rates by cause and age (e.g. cardiac...).
2/ NL 15-19 years: nothing to see, except MH17 incident 2014.
3/ NL 20-24 years: nothing to see here, except MH17 incident 2014.
4/ NL 25-29 years: nothing to see here. MH17 incident 2014 still visible above the normal rates.
5/ NL 30-34 years: nothing to see here. MH17 incident 2014 still there.
6/ NL 35-39 years: nothing to see here.
7/ NL 40-44 years: nothing to see here.
8/ NL 45-49 years: nothing to see here.
9/ NL 50-54 years: nothing to see here.
10/ NL 55-59 years: nothing to see here.
11/ NL 60-64 years: nothing to see here. Seasonality starts to get visible in this age group.
12/ NL 65-69 years: seasonality visible. Also the sharp but short peak of the first C19 wave. But not at amplitudes that would justify a general panic.
13/ NL 70-74 years: seasonality visible. Sharp but short peak of the first C19 wave. The 2020 spring peak was higher (but shorter) than the typical flu wave. The total peak area is comparable with the 2018 flu season. The 2nd 2020 autumn wave was longer.
14/ NL 75-79 years: seasonality visible. Sharp but short peak of the first C19 wave. The 2020 spring peak was higher (but shorter) than the typical flu wave. The total peak area is comparable with the 2018 flu season. The 2nd 2020 autumn wave was longer.
15/ NL 80-84 years: seasonality visible. Sharp but short peak of the first C19 wave. The 2020 spring peak was higher (but shorter) than the typical flu wave. The total peak area is comparable with the 2018 flu season. The 2nd 2020 autumn wave was longer.
16/ NL 85-89 years: seasonality visible. Sharp but short peak of the first C19 wave. The 2020 spring peak was higher (but shorter) than the typical flu wave. The total peak area is comparable with the 2018 flu season. The 2nd 2020 autumn wave was longer.
17/ Conclusion for 2021:
1) Seasons start at different times--> little can be said now for 21/22 season.
2) The background is higher (even in the young) than any potential vax signal. It would be a disaster if vax would be visible in total mortality.
3) We need data by cause.
18/ To assess any vax safety issues in detail we need:
4) mortality figures by cause, gender and age bin for the young cohorts(<65), e.g. cardiac events.
5) IC data by cause, gender and age for the young cohorts (<65) e.g. cardiac events and thrombotic events.
19/ Source NL mortality data:
ec.europa.eu/eurostat/datab…

• • •

Missing some Tweet in this thread? You can try to force a refresh
 

Keep Current with Orwell2024

Orwell2024 Profile picture

Stay in touch and get notified when new unrolls are available from this author!

Read all threads

This Thread may be Removed Anytime!

PDF

Twitter may remove this content at anytime! Save it as PDF for later use!

Try unrolling a thread yourself!

how to unroll video
  1. Follow @ThreadReaderApp to mention us!

  2. From a Twitter thread mention us with a keyword "unroll"
@threadreaderapp unroll

Practice here first or read more on our help page!

More from @orwell2022

2 Nov
1/ NL hospital admission data aggregation on the young cohorts.

1) There is only 1 ICU admission in the 0-14 year bin. (in Q4 is not, shown here). Amazing healthy.

2) We do see a significant increase in numbers in 2021, in particular in Q2 / Q3. When was start of💉😉😌?
2/ The dominating AE should be myocarditis in males.

In NL we have 1.6M males in the 15-29 male group.
With >50% vaccinated and assuming myocarditis rates of e.g. 1:10000 to 1:2000 we expect 80 to 400 cases, or 40 to 200 in Q2 and Q3.
3/ Is it possible to get data on admission root cause statistics from @rivm? In particular the amount of heart related issues in 15-29 old males by quater for 2021?

@mr_Smith_Econ
@dimgrr
@waukema
@PvanHouwelingen
@hugodejonge
@nos
@mauricedehond
@KoenSwinkels
@Lareb_NL
Read 5 tweets
1 Nov
1/ Expected rate of vaccinated in ICU.

(Correcting here the spotted mistake in the explanation part.)

Here is the formula explained. It depends on vaccination rate and vaccine efficiency.

The special case for 90% vaccinated is shown on the right as function of VE-ICU.
2/ For Austria and NL where 90% of the at risk group is vaccinated we expect 30%-50% of the ICU patients to be vaccinated if assuming a VE-ICU of ~90%.
3/ Let's show the results of the formula in 2D as function of

x) vaccination level
y) VE agains ICU

The resulting rate (calculation on right) of vaccinated in ICU is shown in the cell.

It can be used as look-up table to estimate (roughly) the VE.
Read 11 tweets
1 Nov
1/ Expected vaccinated rate in ICU: It looks like I need to add explanations.

Here is the formula explained. It depends on vaccination rate and vaccine efficiency. 2 parameters. Special case for 90% vaccianted is shown in the graph as function of VE.
2/ So what do we expect for Austria where 90% of the risk group ending in ICU is vaccinated. This here. So if the VE agains ICU is around 90%, then we expect 40%-50% of the hispitalized patiend to be vaccinated. This is normal, and not a sign of panic/waning efficiency.
3/ Let's show the results of the formula as function of the x) vaccination rate and y) VE agains ICU now.

The resulting rate (calculation on right) of vaccinated in ICU is shown in the cell.

It can be used as look-up table for other countries. Also to estimate (roughly) the VE
Read 6 tweets
31 Oct
Scheint derzeit zu korrelieren. Im Sommer war das nicht so. Man sollte jedoch besser die Impfquote ab 60 Jahren zeigen. Die ist in NL bei 90%. Generell muss man das nach Alter machen. Sonst droht der wie gewohnt der Simpson's. Image
Wenn wir ICU Daten nach Impfstatus und alter hätten, könnten wir die Länder auf meiner Tabelle eintragen. Die zeigt die erwartete relative ICU Quote geimpft je nach Impfquote und VE_ICU. Image
In Österreich herrscht Panik (wegen mathematischer Inkompetenz). 30%-50% Geimpfte ist jedoch genau der Erwartungswert bei einer Impfquote von 90% und einen Schutz von 90%. Die Kurve rechts zeigt diesen Fall. Es ist die 90% geimpfte Spalte in der 2D Darstellung oben. ImageImage
Read 4 tweets
27 Oct
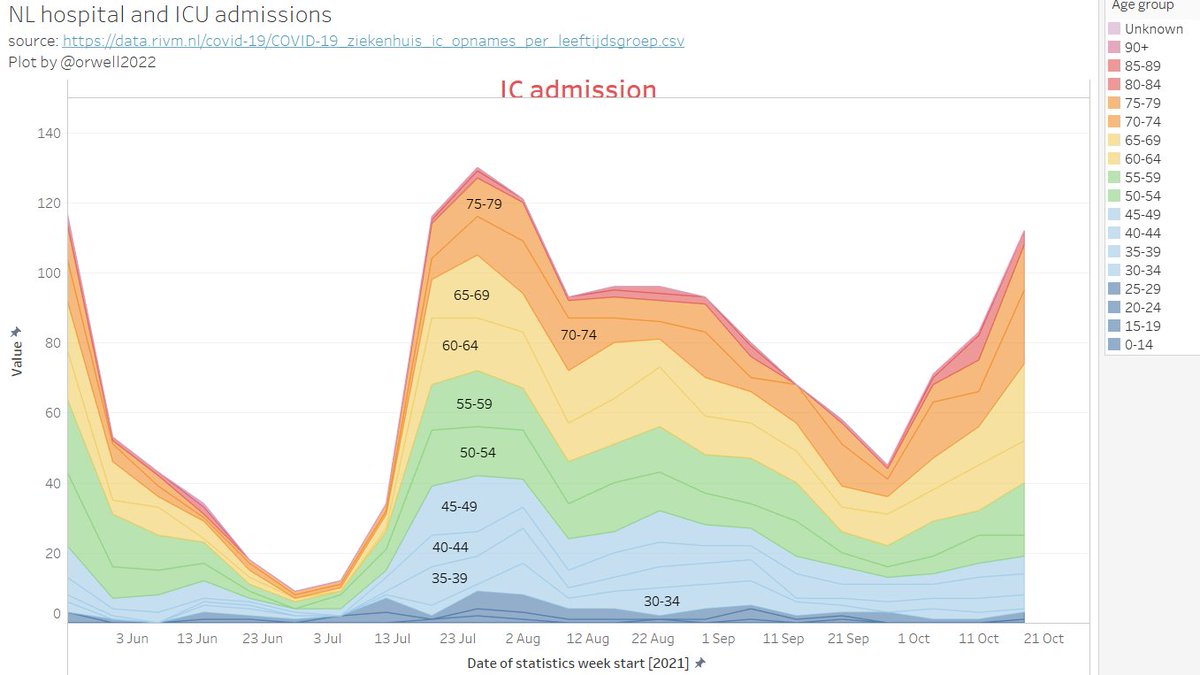
1/ NL hospital and ICU admissions

Find here a vizualisation of the NL data. This are all admission.

We don't have this infromation available for #Covid by age nor for C19 vaccination status by age.
@rivm @hugodejonge Please publish this data.
@rivm @hugodejonge 2/ Let's zoom in on the latest months. The numbers in the age group < 30 years is vanish small. But this is the so called unvaccinated "at risk" group. It's already obvious from this that the statement from Hugo:

"the unvaccinated are flooding the hospitals"

is impossible!
3/ Let's further zoom in on ICU:

People below 30 (so the dominating unvaccinated group) are NOT in ICUs.

The vast majority (80%) is above age 50. But this group is almost fully (~90%) vaccinated.

There is some magic going on if 90% of patient are unvaccinated.
Read 7 tweets
31 Jul
1/ This is a brilliant talk. I appreciated it, in particular being both a computational physicist and a HW veteran.

The bad habits is SW were already spreading back in 2001.

2/ I’m wondering if there are still people around today who would be able to do something like E04DGF and CVode. I doubt that anything has improved at those levels. Is E04DGF still the fastest?
3/ The problem is also, that SW will come and bite the semiconductors, so the HW itself. After having done some work with Cadence I can only say: what a mess. It’s a patch and collection of pieces that they have procured over time. But nothing is consistent across modules.
Read 10 tweets

Did Thread Reader help you today?

Support us! We are indie developers!


This site is made by just two indie developers on a laptop doing marketing, support and development! Read more about the story.

Become a Premium Member ($3/month or $30/year) and get exclusive features!

Become Premium

Too expensive? Make a small donation by buying us coffee ($5) or help with server cost ($10)

Donate via Paypal Become our Patreon

Thank you for your support!

Follow Us on Twitter!

:(