The world is set to add more renewable power capacity in 2021 than ever before
The record-breaking additions of 290 GW of solar, wind & other renewables are yet another sign that A New Global Energy Economy is emerging
Find out more in @IEA's new report: iea.li/3o7lltG
The record-breaking additions of 290 GW of solar, wind & other renewables are yet another sign that A New Global Energy Economy is emerging
Find out more in @IEA's new report: iea.li/3o7lltG

We expect renewables to account for almost 95% of the growth in global power capacity through 2026, with solar PV alone providing more than half
This is driven by stronger support from policies & more ambitious pledges made going into #COP26
Read more: iea.li/3E4wy3L
This is driven by stronger support from policies & more ambitious pledges made going into #COP26
Read more: iea.li/3E4wy3L

India is set for the fastest rate of renewable capacity growth among major economies in the next 5 years, doubling additions versus 2015-2020
This supports 🇮🇳’s new goal of 500 GW of renewable capacity by 2030 & highlights its potential to accelerate its clean energy transition
This supports 🇮🇳’s new goal of 500 GW of renewable capacity by 2030 & highlights its potential to accelerate its clean energy transition

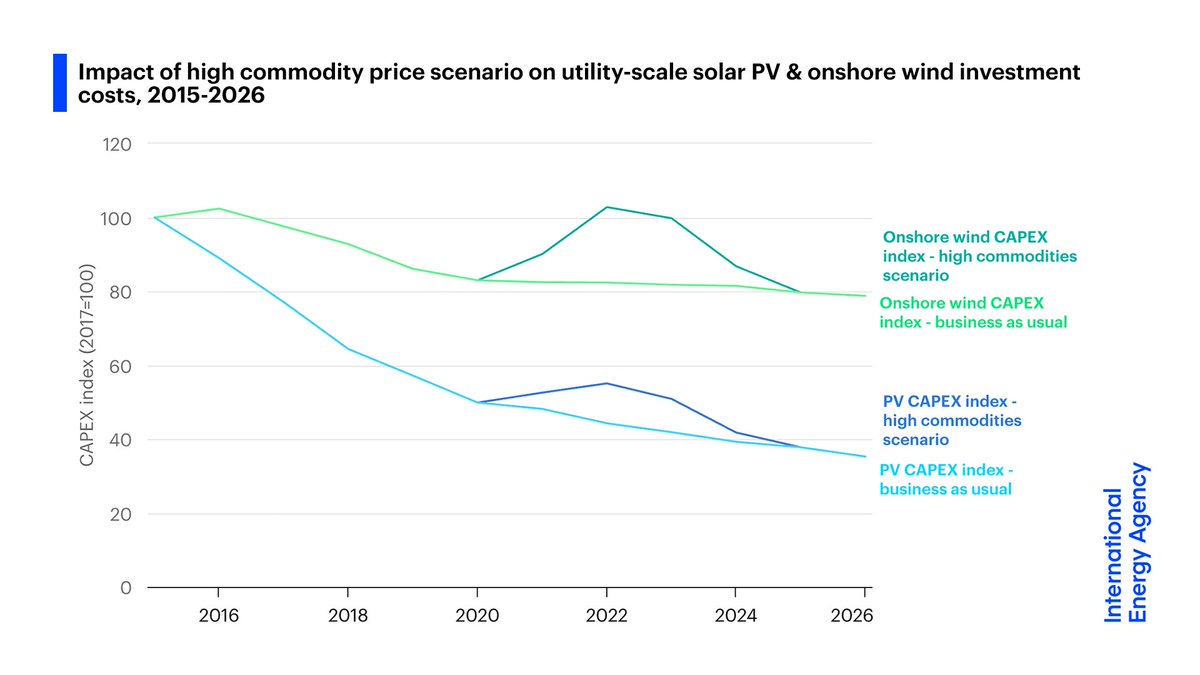
Renewables are on track for record growth despite high commodity & transport prices
But if commodity prices stay high until the end of 2022, it would wipe out 5 years of cost reductions for wind power – and 3 years of reductions for solar PV
But if commodity prices stay high until the end of 2022, it would wipe out 5 years of cost reductions for wind power – and 3 years of reductions for solar PV
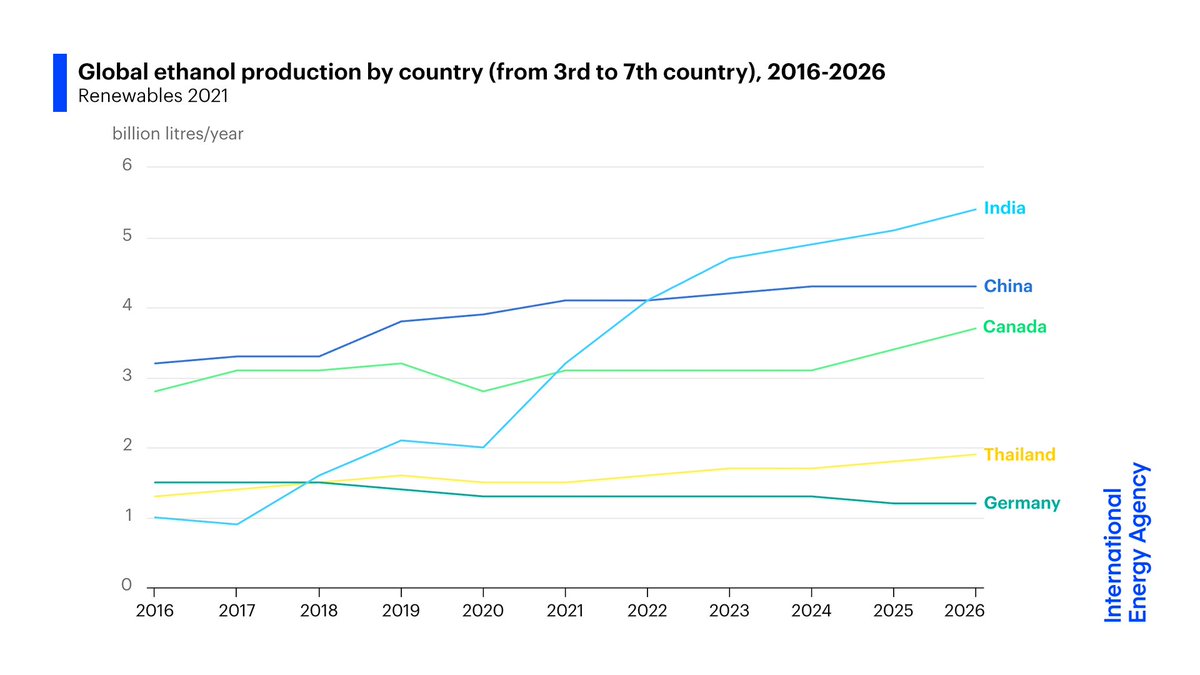
Demand for biofuels is forecast to grow strongly through 2026, with Asia accounting for almost 30% of new production
India is expected to overtake Canada & China in the coming years to become the third largest market for ethanol worldwide, behind the United States & Brazil
India is expected to overtake Canada & China in the coming years to become the third largest market for ethanol worldwide, behind the United States & Brazil
The @IEA report's accelerated case shows renewables can grow even faster to 2026 if policy makers address key barriers.
But reaching #NetZero by 2050 requires even stronger efforts. The rate of renewable capacity additions would need to almost double from the report's main case.
But reaching #NetZero by 2050 requires even stronger efforts. The rate of renewable capacity additions would need to almost double from the report's main case.

For more on @IEA's Renewables 2021 market report, which is available for free on our website, join us for the livestreamed launch event at 11:00 AM Paris time
The report ➡️ iea.li/3o7lltG
The press conference ⬇️ iea.li/3lm7ZIa
The report ➡️ iea.li/3o7lltG
The press conference ⬇️ iea.li/3lm7ZIa
• • •
Missing some Tweet in this thread? You can try to
force a refresh