1/n
🧵on Relative Strength Index (RSI), one of the widely used Indicator in technical analysis by traders.
I am sharing:
1. Intro and the birth of RSI
2. What info RSI indicates
3. Application of RSI with chart patterns
4. Support/Resistance in RSI
5. Range Shift
6. Divergence
🧵on Relative Strength Index (RSI), one of the widely used Indicator in technical analysis by traders.
I am sharing:
1. Intro and the birth of RSI
2. What info RSI indicates
3. Application of RSI with chart patterns
4. Support/Resistance in RSI
5. Range Shift
6. Divergence
2/n
The concept of RSI was first introduced in the book “New Concepts in Technical Trading Systems.” By J. Welles Wilder Jr. Most of us get so attracted to the indicator itself we forget to study the background of Scientists and how the indicator got its life.
The concept of RSI was first introduced in the book “New Concepts in Technical Trading Systems.” By J. Welles Wilder Jr. Most of us get so attracted to the indicator itself we forget to study the background of Scientists and how the indicator got its life.
3/n
Understanding the psychology of the researcher is way more important than the indicator itself. Because indicator is the reflection of researcher’s personality and what they are looking into the markets (and charts).
Understanding the psychology of the researcher is way more important than the indicator itself. Because indicator is the reflection of researcher’s personality and what they are looking into the markets (and charts).
4/n
W Wilder commenced full-time market research and trading in his "retirement.” He served in Korean War in the US Navy post that did engineering in Mechanical. Having a background of Defence (discipline) and Engineering (Calculation) is a powerful combination to study markets.
W Wilder commenced full-time market research and trading in his "retirement.” He served in Korean War in the US Navy post that did engineering in Mechanical. Having a background of Defence (discipline) and Engineering (Calculation) is a powerful combination to study markets.
5/n
Welles Wilder is best known for his technical indicators – now considered to be core indicators in technical analysis. These include Average True Range, the #RelativeStrengthIndex, Directional Movement and the Parabolic Stop and Reverse.
Welles Wilder is best known for his technical indicators – now considered to be core indicators in technical analysis. These include Average True Range, the #RelativeStrengthIndex, Directional Movement and the Parabolic Stop and Reverse.
6/n
Wilder said, “I’ve found that the most important thing in trading is always doing the right thing, whether or not you win or lose - – how much you make depends on where you enter and exit the markets." This thought formed the base of the #RSI Indicator.
Wilder said, “I’ve found that the most important thing in trading is always doing the right thing, whether or not you win or lose - – how much you make depends on where you enter and exit the markets." This thought formed the base of the #RSI Indicator.
7/n
RSI is an oscillator from the family of #MOMENTUM indicators that measures the magnitude of recent price changes in stock. Traditionally, #RSI was used to evaluate OVERBOUGHT or OVERSOLD conditions in the stock price. That is no longer true, will explain this as we progress.
RSI is an oscillator from the family of #MOMENTUM indicators that measures the magnitude of recent price changes in stock. Traditionally, #RSI was used to evaluate OVERBOUGHT or OVERSOLD conditions in the stock price. That is no longer true, will explain this as we progress.
8/n
Traditional interpretation of RSI was that if RSI values of 70 or above indicate that the security is becoming overbought (overvalued) and may get a trend reversal or corrective pullback in price. An RSI reading of 30 or below indicates an oversold or undervalued condition.
Traditional interpretation of RSI was that if RSI values of 70 or above indicate that the security is becoming overbought (overvalued) and may get a trend reversal or corrective pullback in price. An RSI reading of 30 or below indicates an oversold or undervalued condition.
9/n
But when you deep dive into the study of RSI indicators you will find Overbought and Oversold values will not make sense if you look at them in isolation. For any indicator, context is very important. I have explained this concept in detail with examples.
But when you deep dive into the study of RSI indicators you will find Overbought and Oversold values will not make sense if you look at them in isolation. For any indicator, context is very important. I have explained this concept in detail with examples.
10/n
For calculating RSI, we consider the price on a closing basis. We are interested in the strength of Bulls Vs Bears and viceversa.
So,
Gains = If current price is higher than previous price
Loss = If Current price is lower than previous price
This gives us relative strength
For calculating RSI, we consider the price on a closing basis. We are interested in the strength of Bulls Vs Bears and viceversa.
So,
Gains = If current price is higher than previous price
Loss = If Current price is lower than previous price
This gives us relative strength

11/n
So Avg gains will be the addition of all gains (green candle) divided by the Total Number of Bullish Candles
And Avg loss will be the addition of all loss (red candles) divided by the Total Number of Bearish Candles
So Avg gains will be the addition of all gains (green candle) divided by the Total Number of Bullish Candles
And Avg loss will be the addition of all loss (red candles) divided by the Total Number of Bearish Candles

12/n
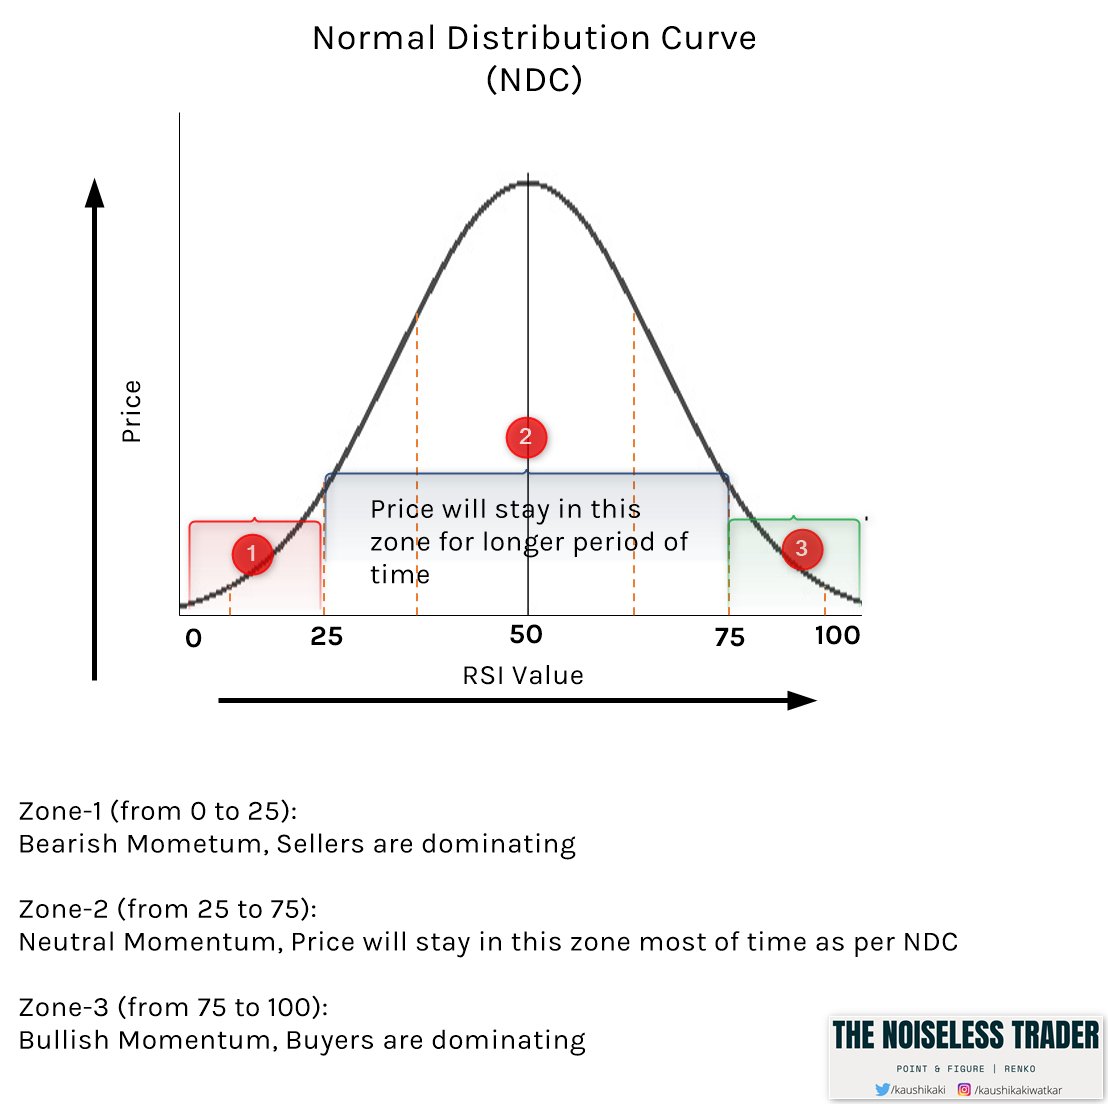
Wilder recommended a 14-day parameter and he believed that price will tend to remain in the range of 25-75 max time, this concept was borrowed by the Normal Distribution Curve.
He gave 3 zones:
Below 25: Bearish Momentum
Between 25 and 75: Neutral
Above 75: Bullish Momentum
Wilder recommended a 14-day parameter and he believed that price will tend to remain in the range of 25-75 max time, this concept was borrowed by the Normal Distribution Curve.
He gave 3 zones:
Below 25: Bearish Momentum
Between 25 and 75: Neutral
Above 75: Bullish Momentum
13/n
In my previous thread of MA, I have explained how to identify trends, so we will borrow the concept of trend and Inherently Bullish/Bearish stock identification from that thread
In my previous thread of MA, I have explained how to identify trends, so we will borrow the concept of trend and Inherently Bullish/Bearish stock identification from that thread
https://twitter.com/kaushikaki/status/1459466104795893763?s=20
14/n
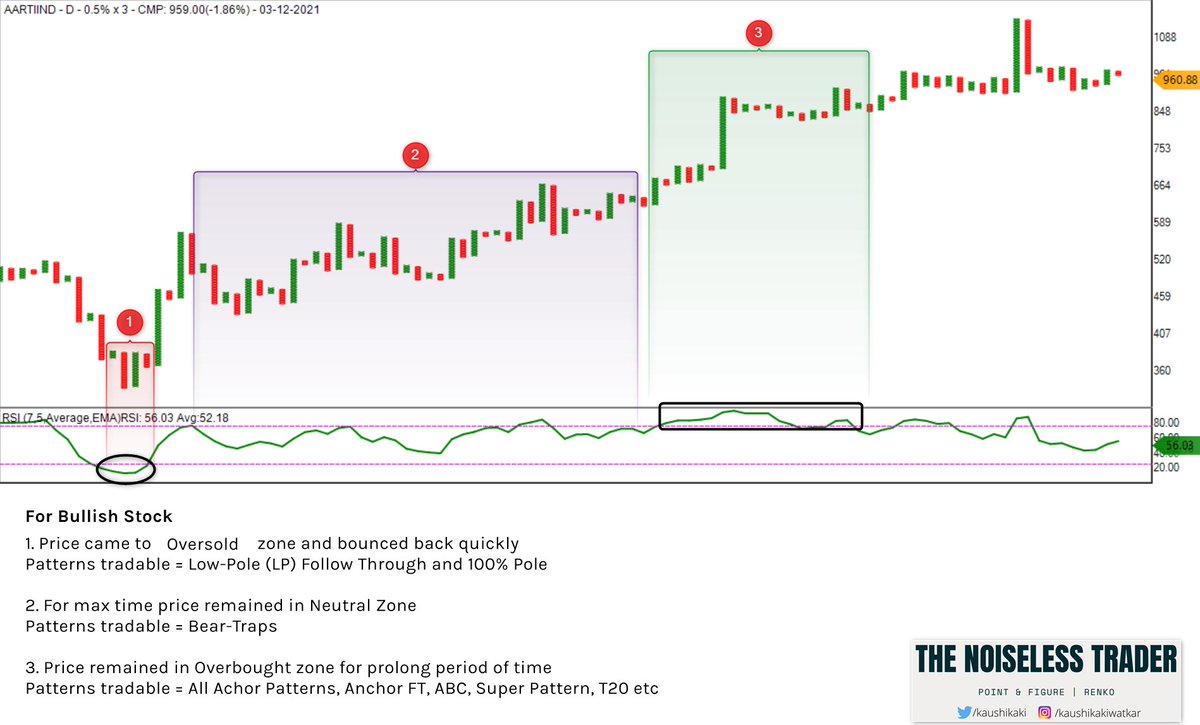
For inherently BULLISH stock, Avg GAINS > Avg LOSS
So, RSI cannot be in the Oversold region for a longer period of time but can remain in the Overbought zone for a prolonged period of time.
#BAJFINANCE #BajajFinance
For inherently BULLISH stock, Avg GAINS > Avg LOSS
So, RSI cannot be in the Oversold region for a longer period of time but can remain in the Overbought zone for a prolonged period of time.
#BAJFINANCE #BajajFinance


15/n
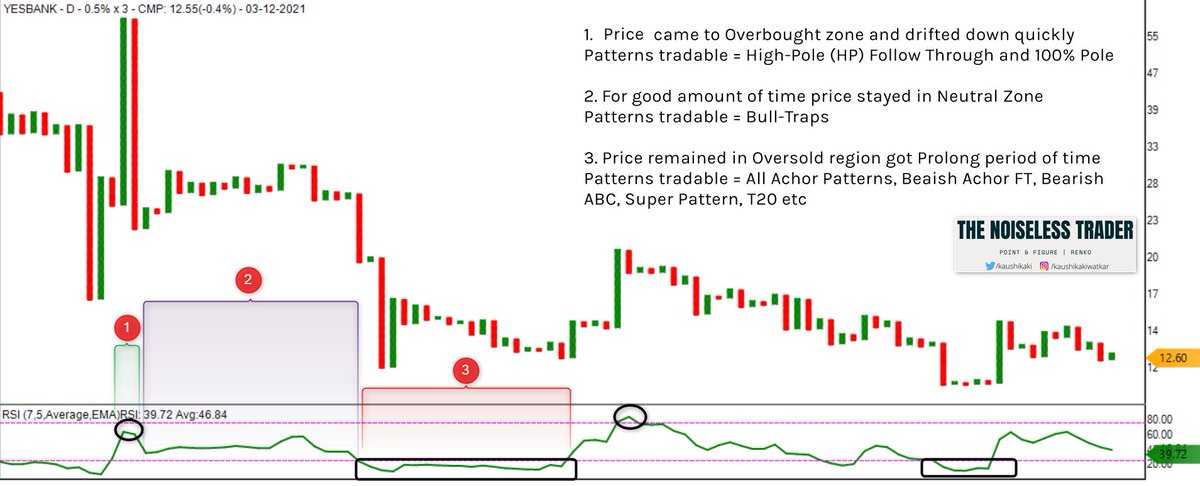
For inherently BEARISH stock, Avg LOSS > Avg GAINS
So, RSI cannot be in the Overbought region for a longer period of time but can remain in the Oversold zone for a prolonged period of time.
#lichsgfin #LIC #quickheal
For inherently BEARISH stock, Avg LOSS > Avg GAINS
So, RSI cannot be in the Overbought region for a longer period of time but can remain in the Oversold zone for a prolonged period of time.
#lichsgfin #LIC #quickheal


17/n
The price movement for inherently Bullish Stock is Oversold (Short-duration) --> Neutral --> Overbought (Prolong Period) --> Neutral and the cycle goes on.
Explaining it with help of charts the three phases and how to trade them (Patterns).
The price movement for inherently Bullish Stock is Oversold (Short-duration) --> Neutral --> Overbought (Prolong Period) --> Neutral and the cycle goes on.
Explaining it with help of charts the three phases and how to trade them (Patterns).
18/n
The price movement for inherently Bearish Stock is Overbought (Short Period) --> Neutral --> Oversold (Prolong Period) --> Neutral and the cycle goes on.
Explaining it with help of charts the three phases and how to trade them (Patterns).
The price movement for inherently Bearish Stock is Overbought (Short Period) --> Neutral --> Oversold (Prolong Period) --> Neutral and the cycle goes on.
Explaining it with help of charts the three phases and how to trade them (Patterns).
19/n
How one should Interpret #RSI?
- RSI measures how quickly traders are bidding the price of the security up or down.
- It tells you how strong or weak is the momentum of a current trend.
- Indicators should always be traded with Price action.
How one should Interpret #RSI?
- RSI measures how quickly traders are bidding the price of the security up or down.
- It tells you how strong or weak is the momentum of a current trend.
- Indicators should always be traded with Price action.
20/n
RSI can be used by all types of traders. You just need to identify your trading style and psychology. I have further defined the type of trader and what RSI Zone you should look at for initiating your trade.
RSI can be used by all types of traders. You just need to identify your trading style and psychology. I have further defined the type of trader and what RSI Zone you should look at for initiating your trade.


21/n
I will be sharing the following advanced trading concept of RSI strategy in YT live on Wed (8th Dec)
1. RSI Support and Resistance
2. Trading Intraday setup with RSI
3. Range Shift in RSI
4. Trading RSI Divergence
5. Picking Top and Bottoms with help of RSI
See you on Wed!
I will be sharing the following advanced trading concept of RSI strategy in YT live on Wed (8th Dec)
1. RSI Support and Resistance
2. Trading Intraday setup with RSI
3. Range Shift in RSI
4. Trading RSI Divergence
5. Picking Top and Bottoms with help of RSI
See you on Wed!
22/n
If this thread helped you, please re-tweet and help other fellow traders in their learning curve.
If you like my content, follow me on @kaushikaki
Subscribe to my YT channel: youtube.com/c/TheNoiseless…
Join telegram channel: t.me/thenoiselesstr…
If this thread helped you, please re-tweet and help other fellow traders in their learning curve.
If you like my content, follow me on @kaushikaki
Subscribe to my YT channel: youtube.com/c/TheNoiseless…
Join telegram channel: t.me/thenoiselesstr…
• • •
Missing some Tweet in this thread? You can try to
force a refresh