(sigh)
who is ready for even more charts
who is ready for even more charts
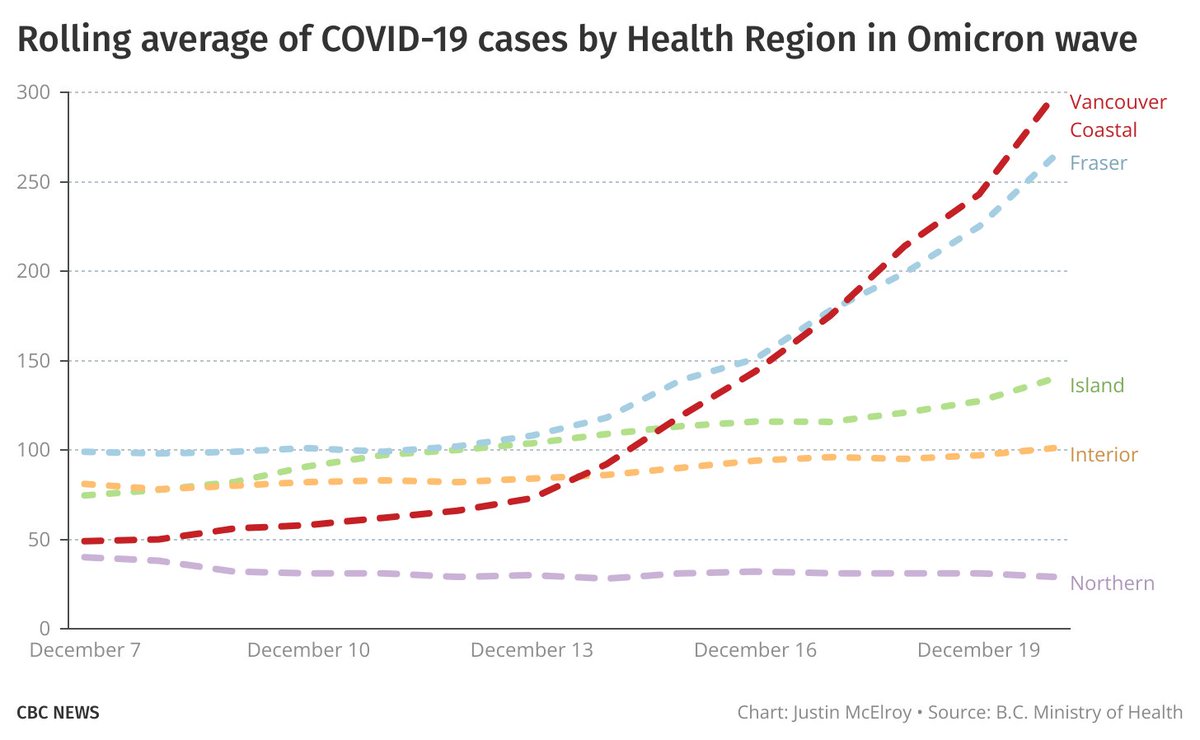
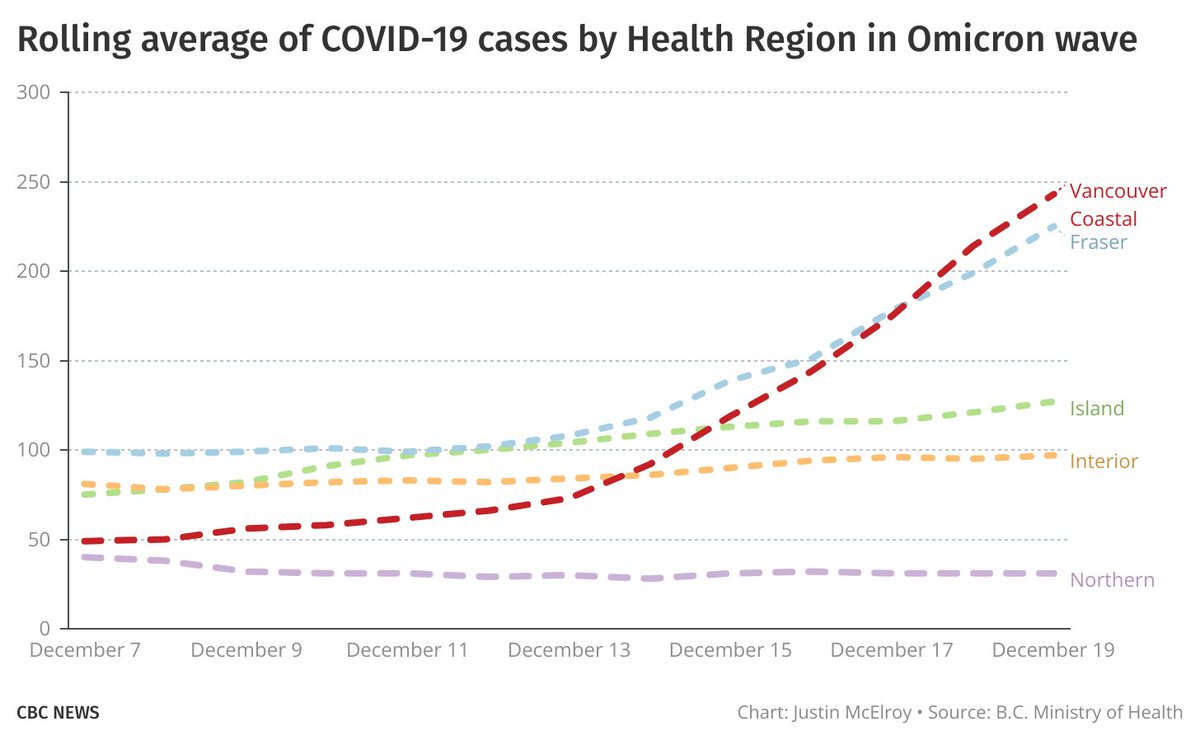
So, where is this wave picking up fastest right now?
The Lower Mainland, full stop.
Vancouver still exploding, but Fraser Health picking up speed.
Consistent with what we're seeing in other places with Omicron — it's the densest places getting hit fastest (at least for now).
The Lower Mainland, full stop.
Vancouver still exploding, but Fraser Health picking up speed.
Consistent with what we're seeing in other places with Omicron — it's the densest places getting hit fastest (at least for now).
What can we about the vaccine status of people getting Omicron in British Columbia?
Government only provides data on a rolling weekly basis.
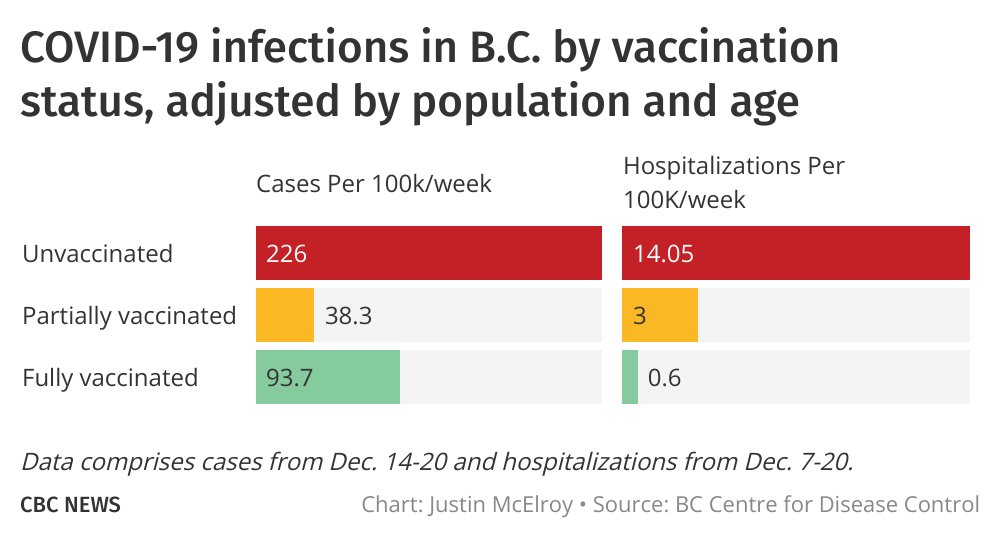
But the per capita rate of people with two doses getting infected doubled last week, compared to only going up 20% for the unvaccinated.
Government only provides data on a rolling weekly basis.
But the per capita rate of people with two doses getting infected doubled last week, compared to only going up 20% for the unvaccinated.
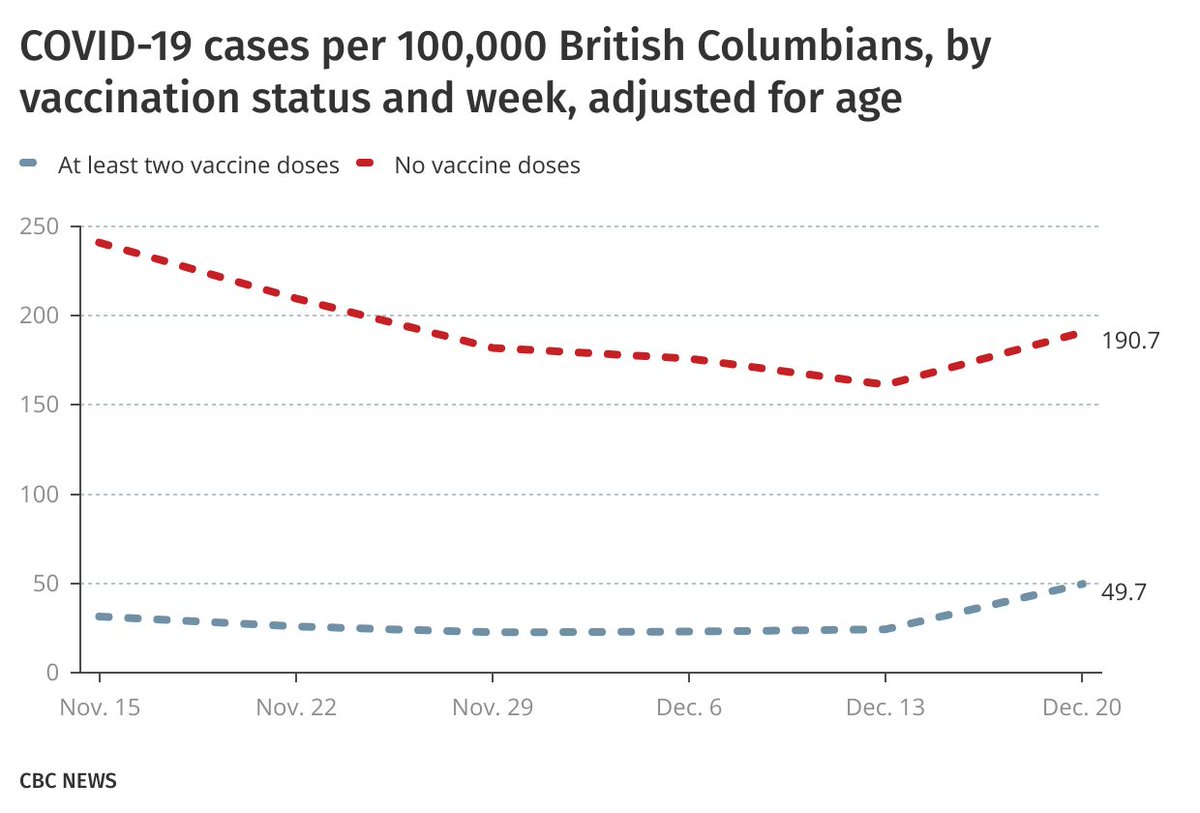
But what does this mean?
Well, it means (very broadly) that unvaccinated people last week got infected at a rate five times higher than unvaccinated people, instead of ten.
Still a big gap!
And ratio for hospitalizations remains the same — and will be key in the weeks ahead.
Well, it means (very broadly) that unvaccinated people last week got infected at a rate five times higher than unvaccinated people, instead of ten.
Still a big gap!
And ratio for hospitalizations remains the same — and will be key in the weeks ahead.

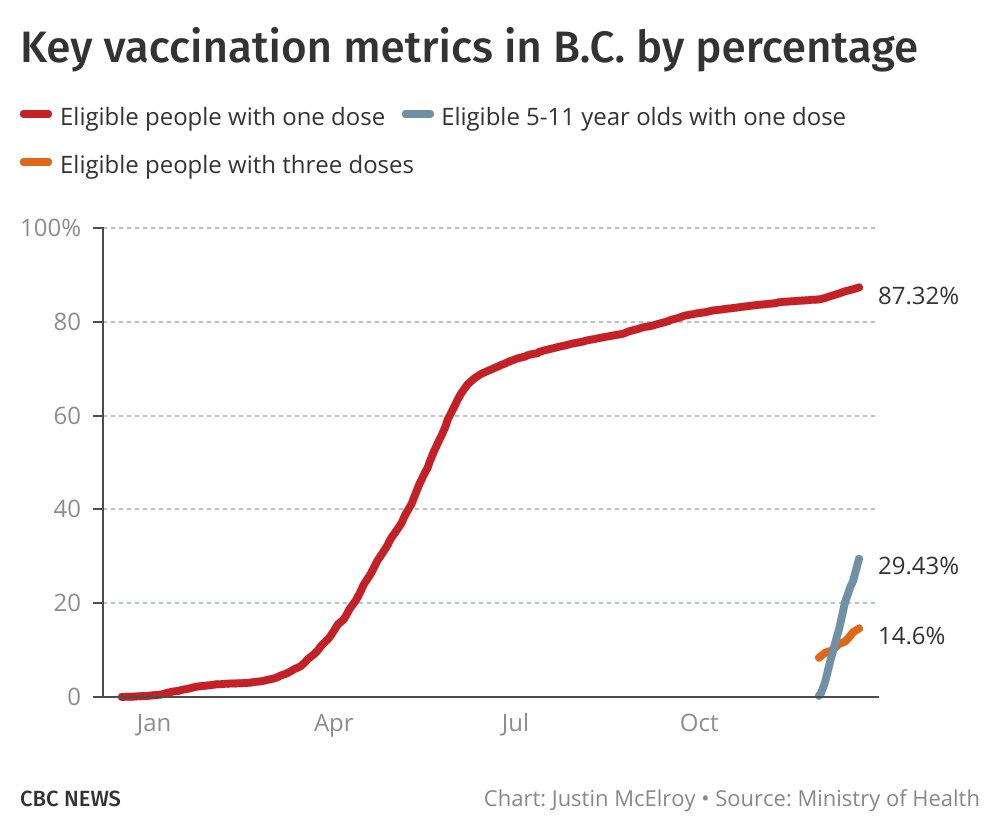
Where are we in the vaccination campaign?
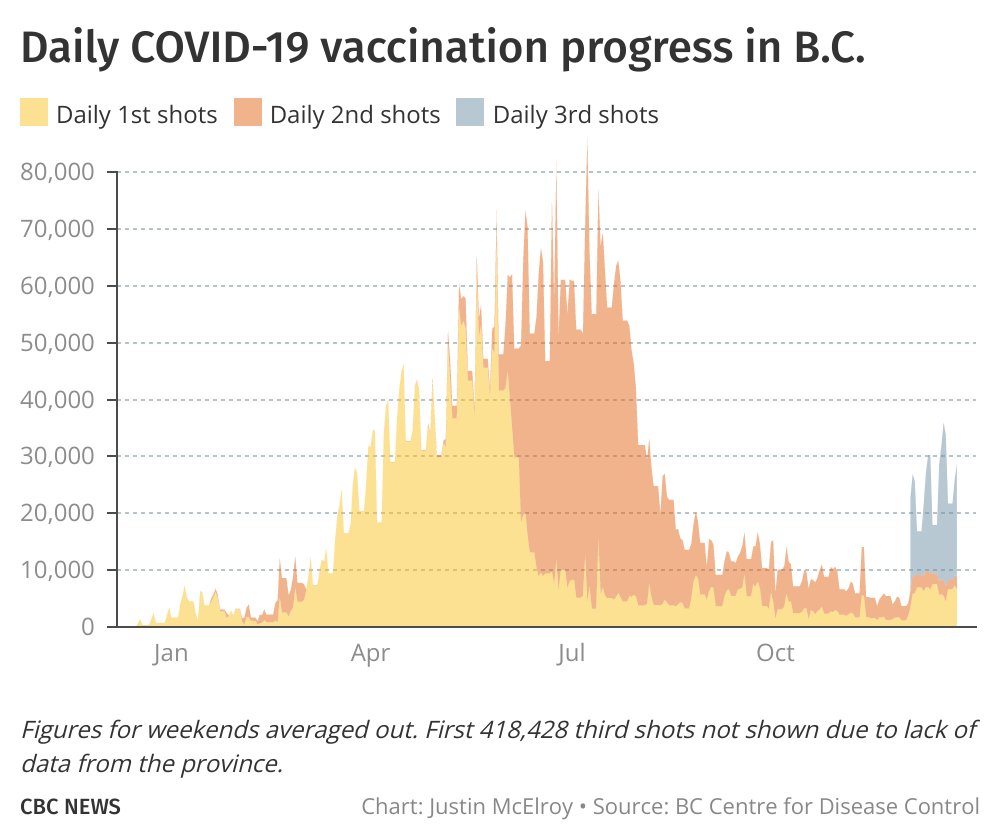
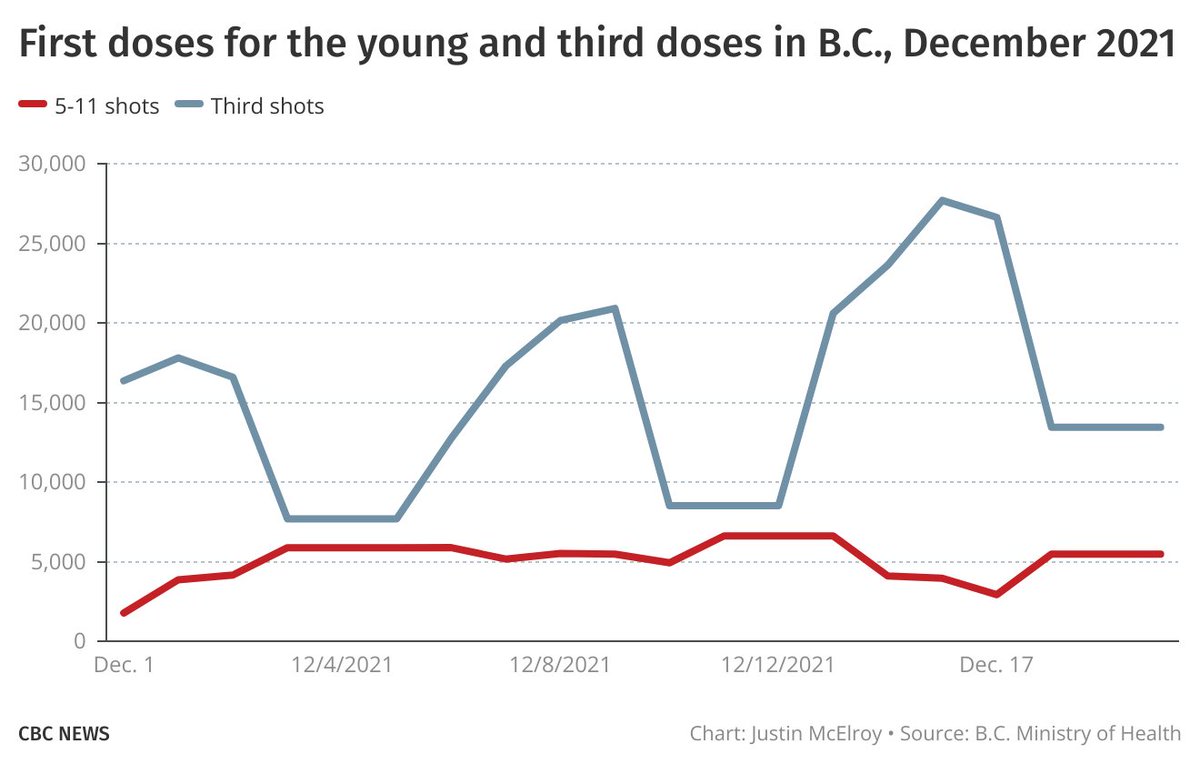
Here's an *updated* chart, showing total shots per day (1st, 2nd and 3rd) since third doses and first doses for kids began in earnest.
Still less than half the number of daily shots as the peak of the campaign.
Here's an *updated* chart, showing total shots per day (1st, 2nd and 3rd) since third doses and first doses for kids began in earnest.
Still less than half the number of daily shots as the peak of the campaign.

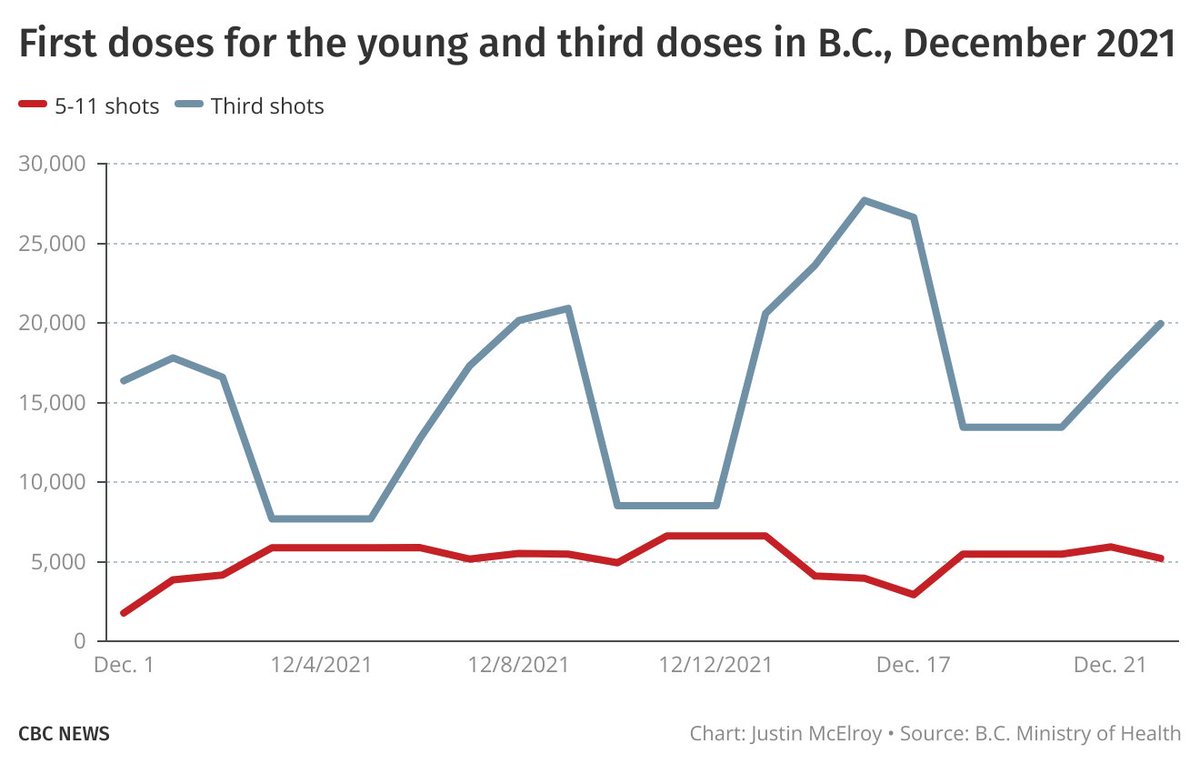
We're picking up the speed for third doses, but not first doses for children — but there are a heck of a lot more third doses to be delivered, so that *pace* is going slower.
(are these two charts helpful? i'm still on the fence for these two)
(are these two charts helpful? i'm still on the fence for these two)
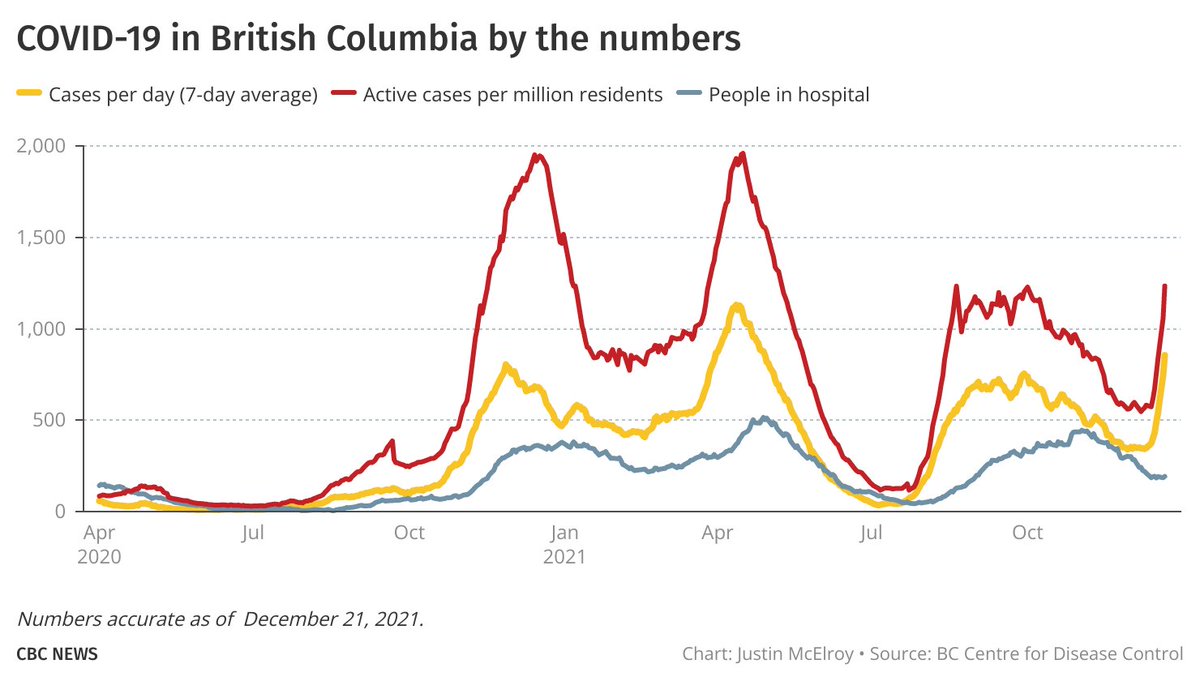
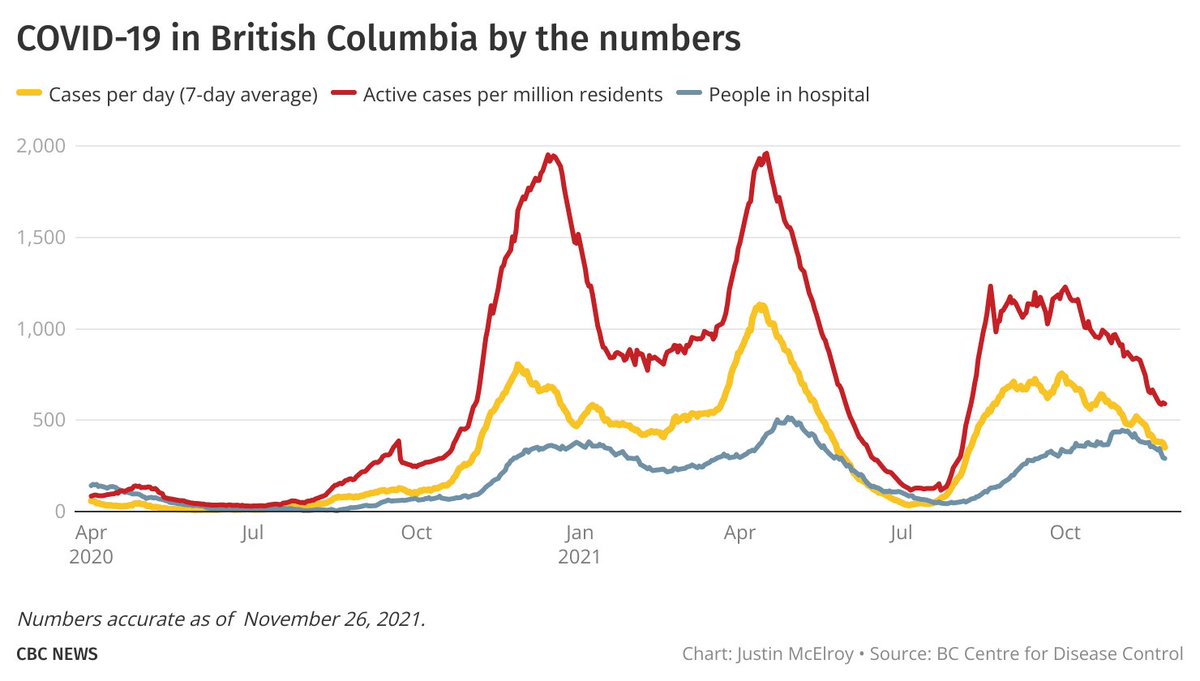
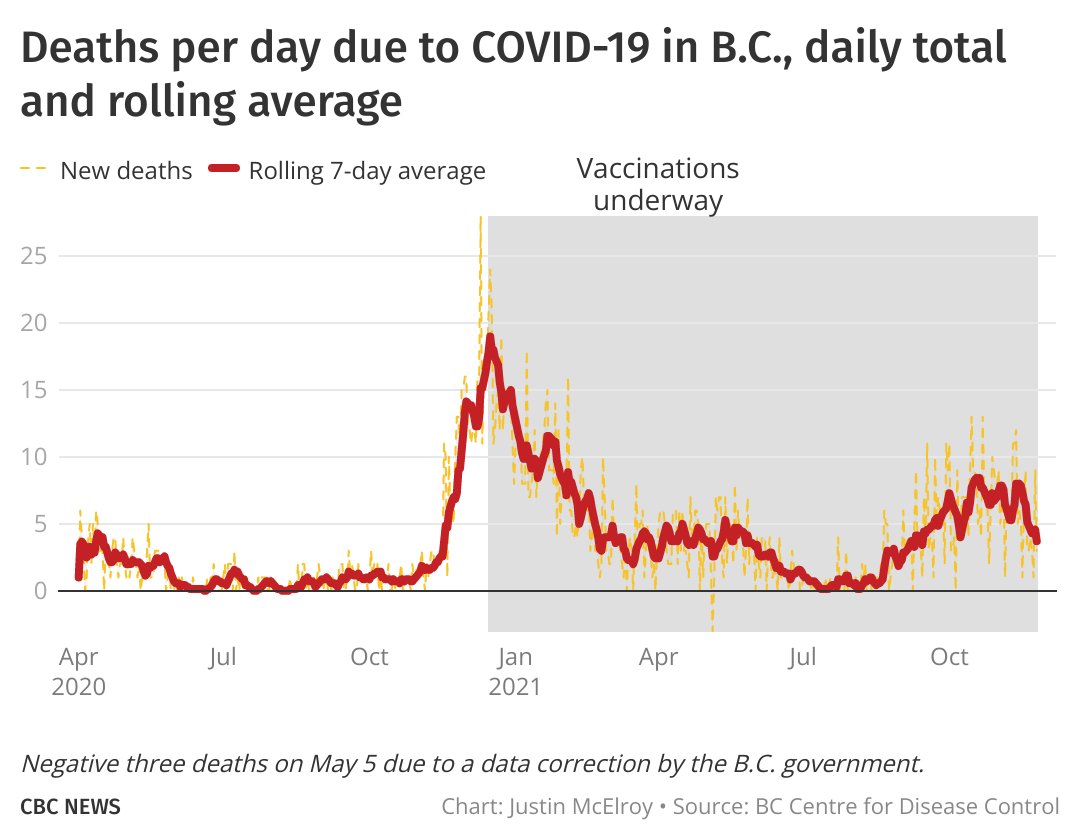
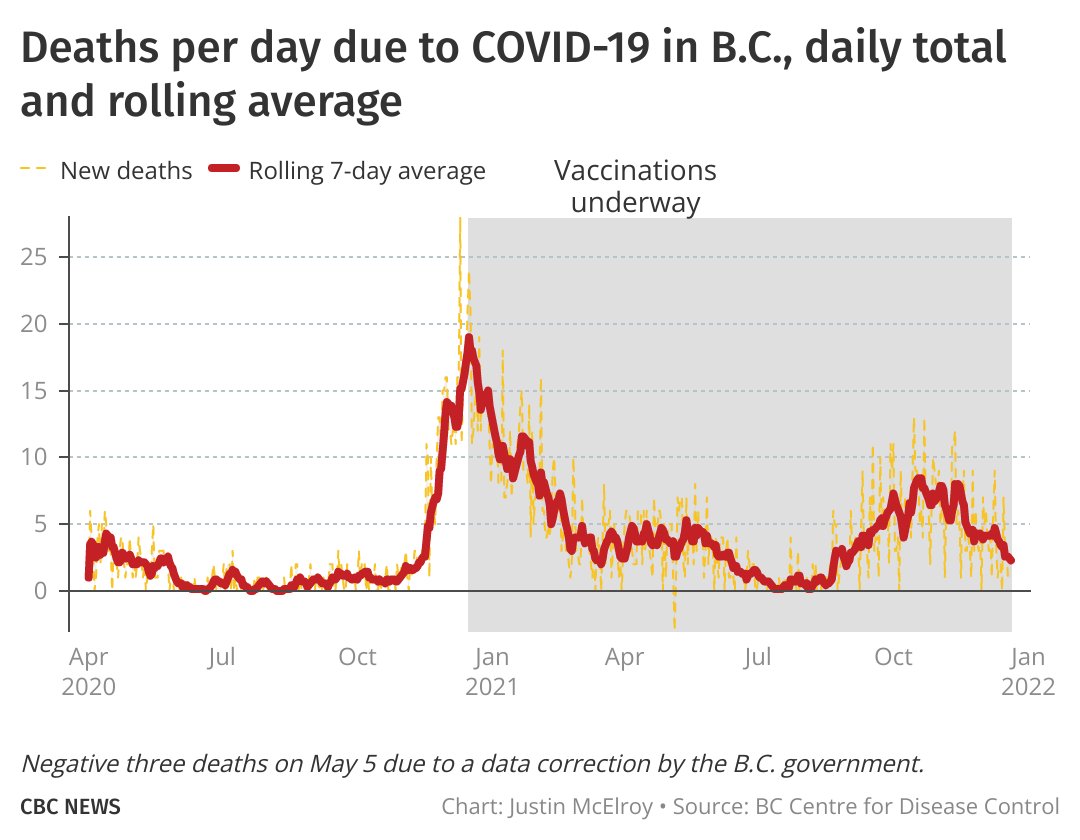
Let's wrap up with hospitalizations and deaths, and where are baseline is.
Deaths, at 2.29 a day, are at their lowest level since September 1.
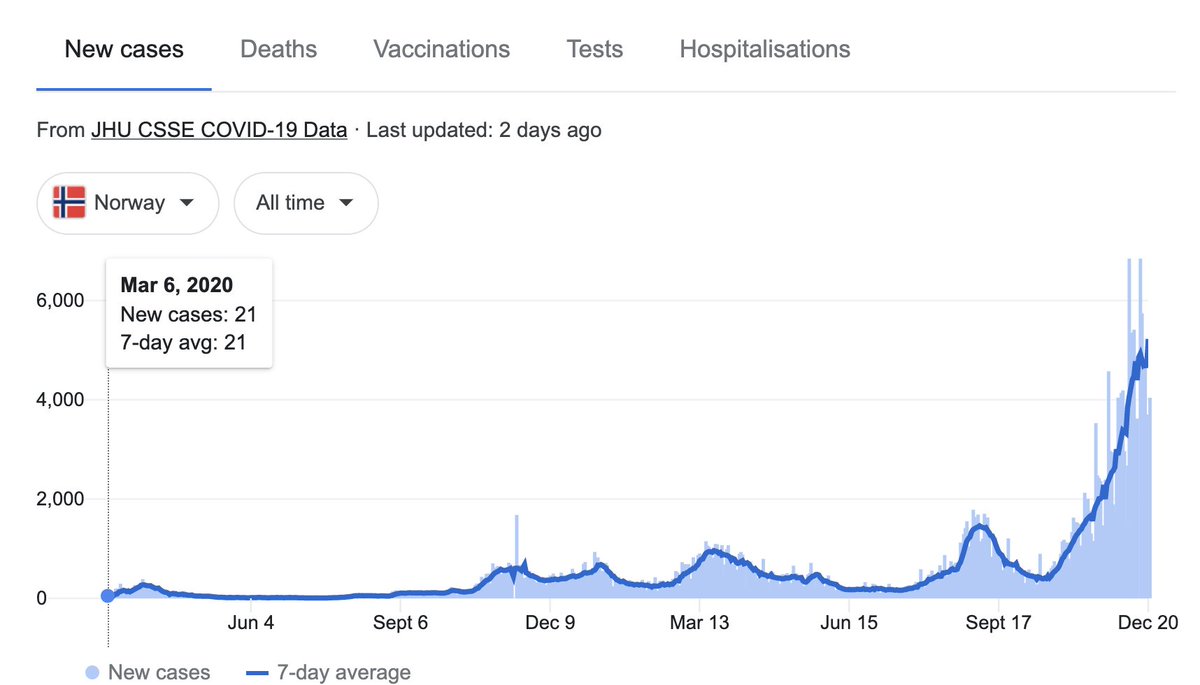
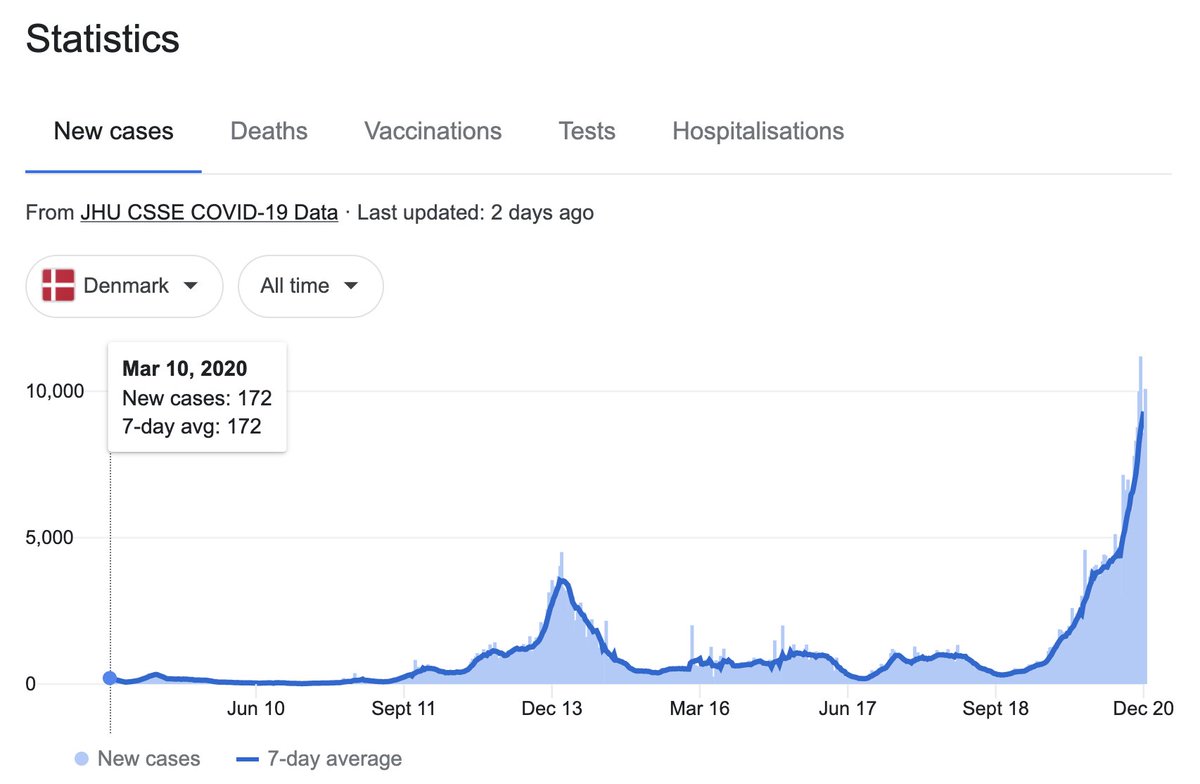
We'll get a good sense of where this might go from other jurisdictions over the next week.
Deaths, at 2.29 a day, are at their lowest level since September 1.
We'll get a good sense of where this might go from other jurisdictions over the next week.

oh no i tweeted 11 charts today
promise that won't be the case every day.
But let's wrap our heads around what the next couple weeks will look like, and how during that time we'll get a much better sense of where we're heading.
Until then, we'll have to muddle through somehow.
promise that won't be the case every day.
But let's wrap our heads around what the next couple weeks will look like, and how during that time we'll get a much better sense of where we're heading.
Until then, we'll have to muddle through somehow.
• • •
Missing some Tweet in this thread? You can try to
force a refresh