* Analysis of 22 Texas TSA Hospital Regions grouped into 8 regional charts
* The Western part of the state has peaked for now. Will it stay that way? If so, not much of a wave
* Only new TX growth is in Houston
* Start Date on all Charts is Jun 1
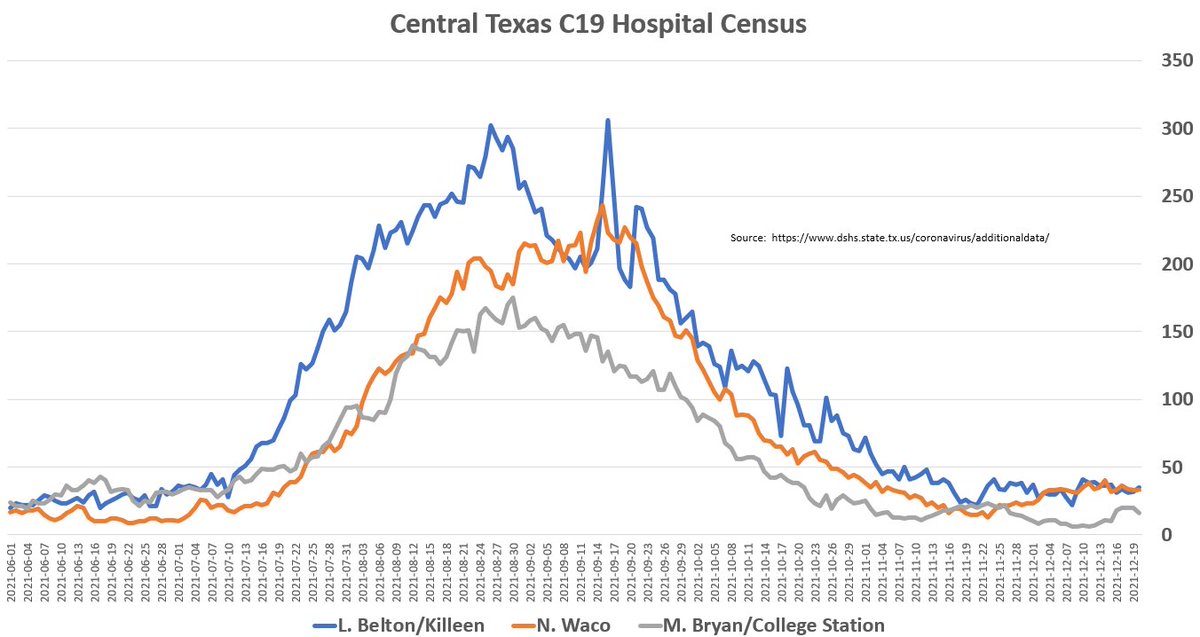
* Census for all four TSAs are in decline, as is change in 7DMA
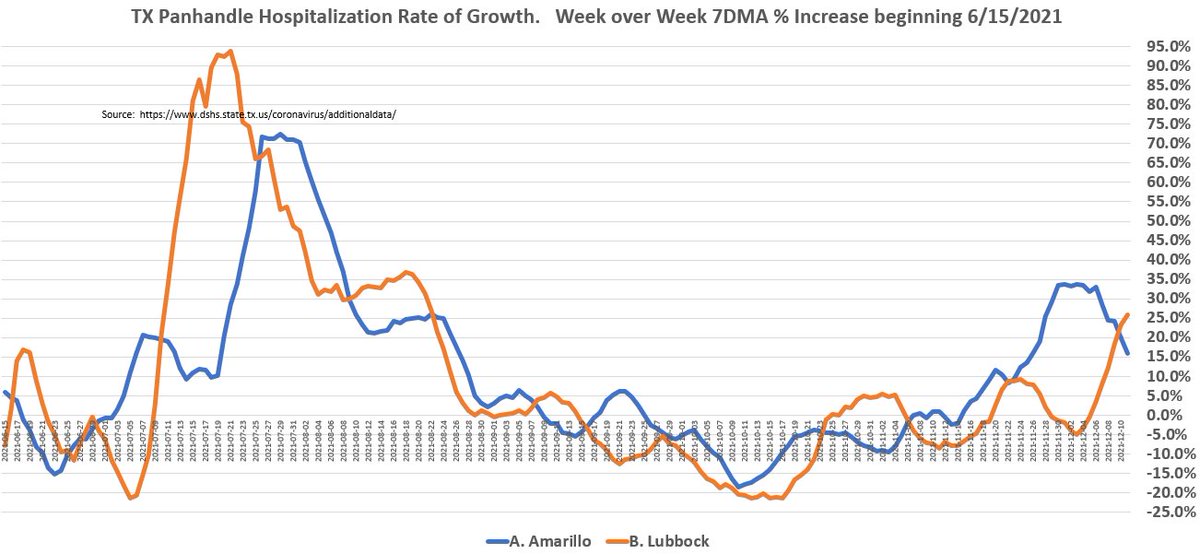
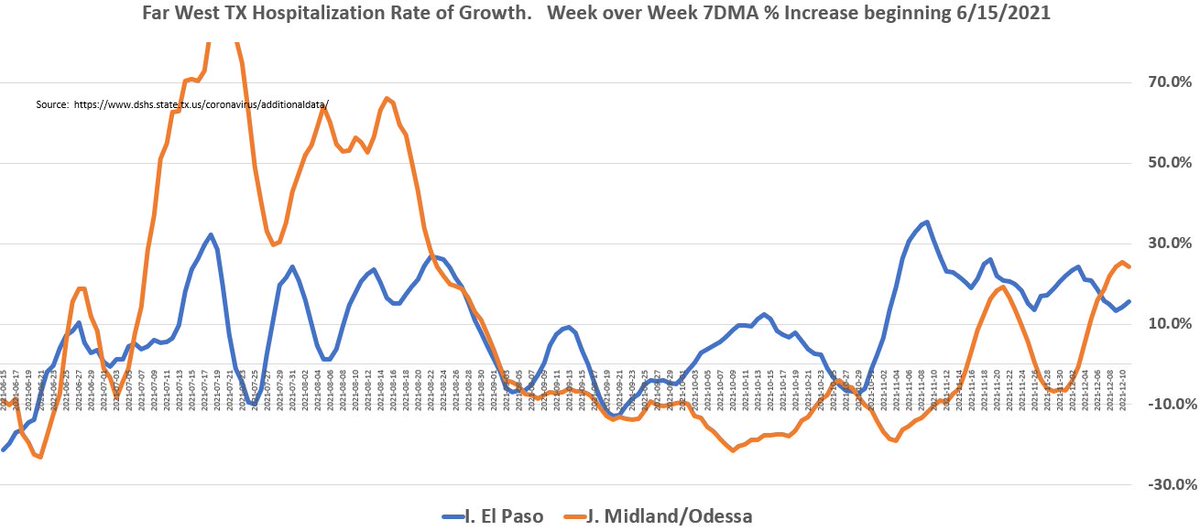
* El Paso & Amarillo is in strong decline, which mirrors case rates in New Mexico
* Are these areas post peak or another wave coming We'll see
2/n .
Texas Metro Triangle
* Only Houston showing strong recent growth. HOU can make a big impact to state numbers if it starts to offset the declines in 2/n
* The other three metros are really flat. The RoG charts show wave patterns that could indicate some growth is coming?
3/n .
TX Remaining areas
* Going West to East & then South
* Again some spread in the West that may have peaked (Abilene)
* Everywhere else is a bag of nothing
* We'll see if spread keeps moving Southeast, but its really flat across the state, hence why State numbers are flat
4/end
.
• • •
Missing some Tweet in this thread? You can try to
force a refresh
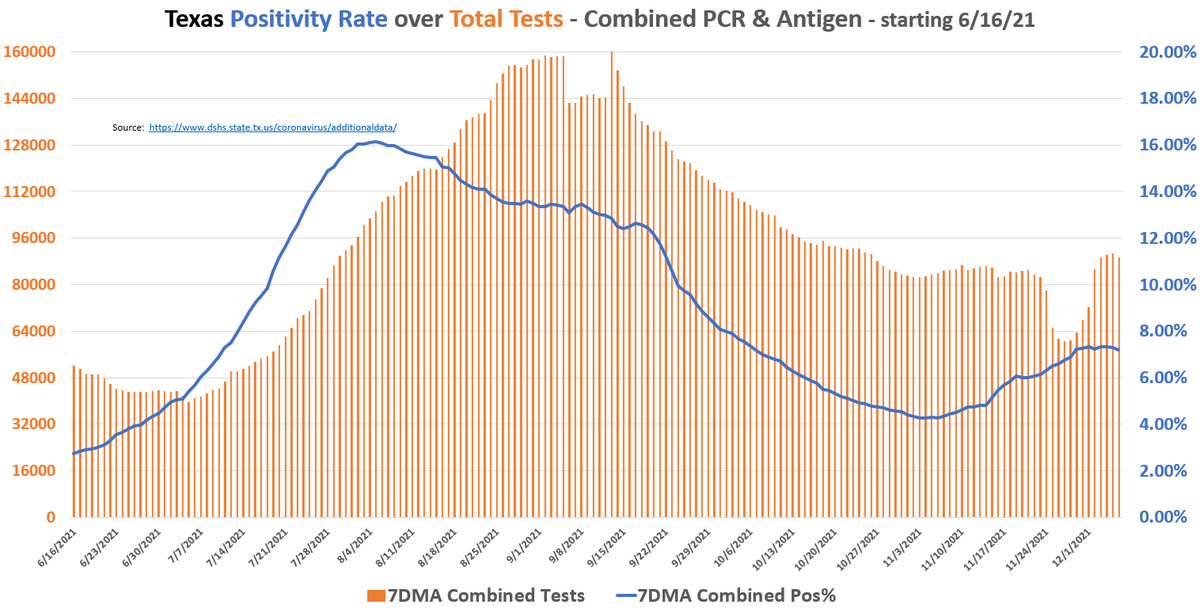
* Testing showing signs of growth
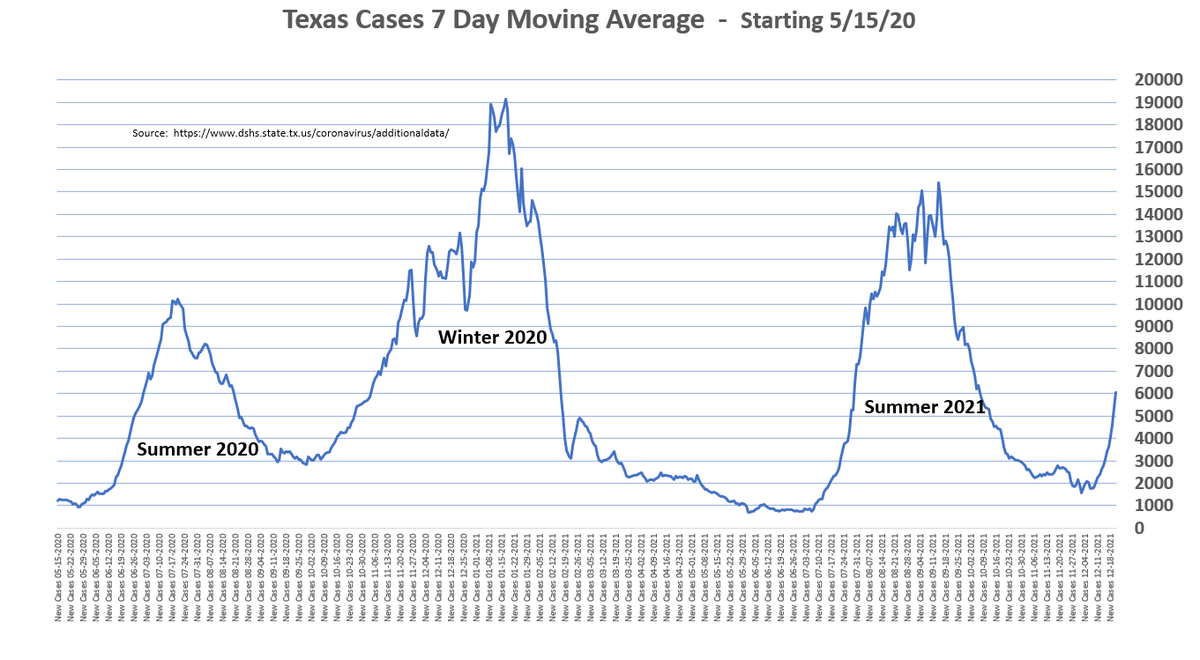
* Cases finally climbing pretty fast as expected
* Case growth will taper soon but continue steadily
* Hospitalizations still flat as can be
* "Winter Wave 2021" right now is a casedemic
Tests filed by date of specimen collection, < 8 days old is incomplete
As of 12/11:
* Pos rate @ 7.57%
* Testing was still < 90K/day, but coming days will show growth, as will pos rate
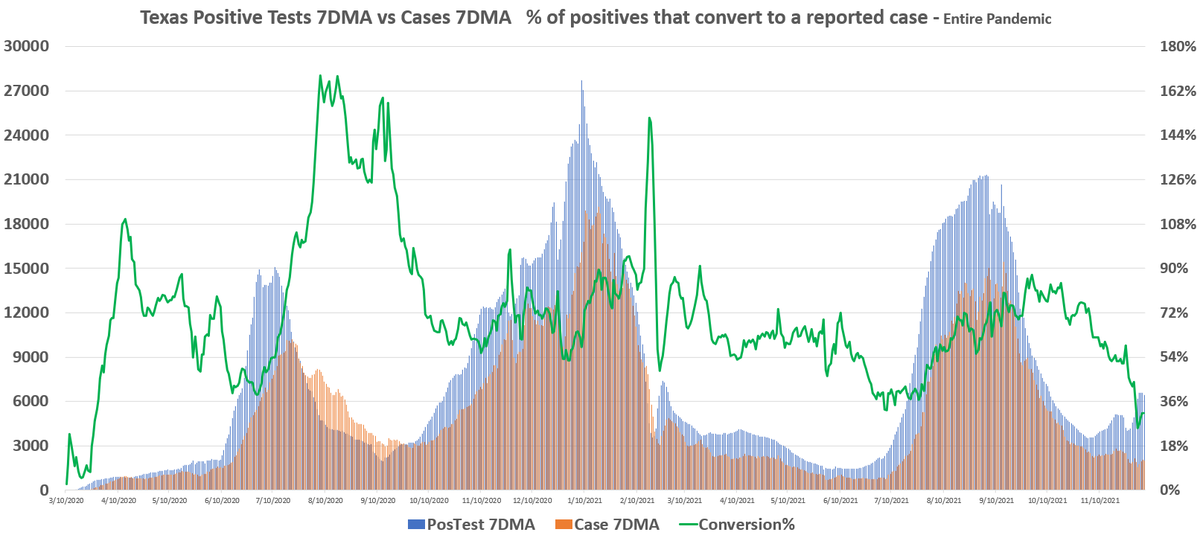
* Conversion of positives to cases finally increasing, hence the cases
2/n .
12/21 - Cases
* Cases are batched by date received by the county
* Winter 2021 cases playing a ton of catch up with positive tests, growth will slow soon
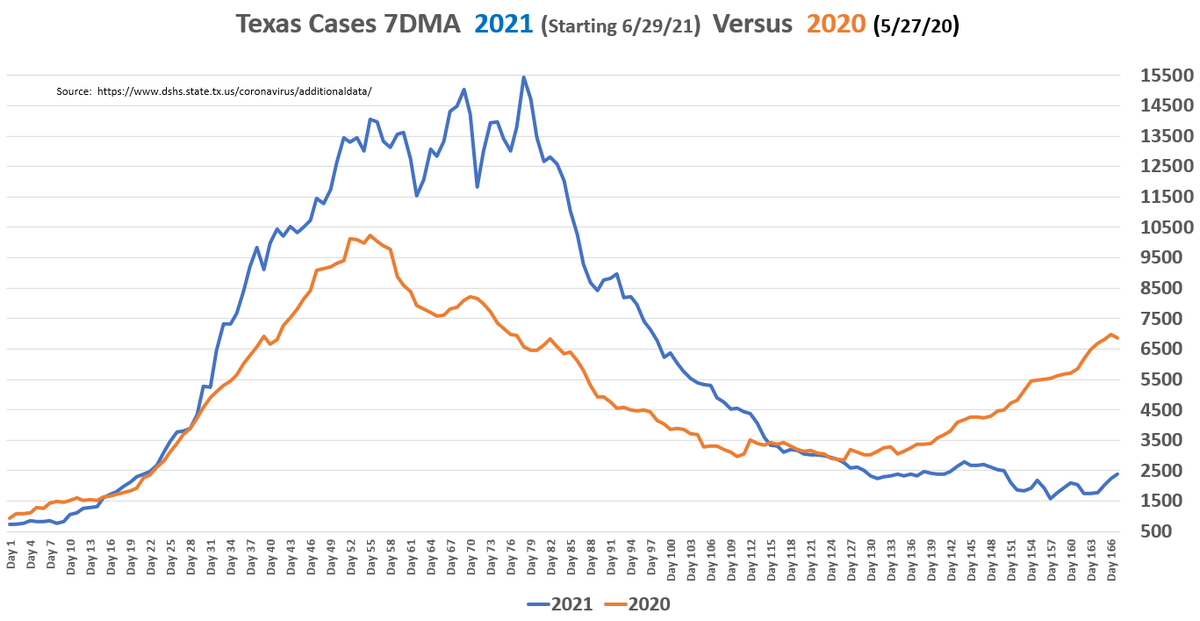
* Vs Winter 2020, while its catching up to the 7DMA, obviously a ton more cases to start the 2020 Winter wave
* Cases finally coming in after lagging way behind positive tests
* SE Texas is showing some spread, while W Texas is post peak
* Statewide testing and hospitalizations still flat as can be
* "Winter Wave 2021" is still a misnomer
Tests filed by date of specimen collection, < 8 days old is incomplete
As of 12/9:
* Pos rate @ 7.42%
* With Testing flat @ 90K/day, means Positives are flat
* But historically low conversion of positives to cases means lots of cases out there
2/n .
12/19 - Cases
* Cases are batched by date received by the county
* Winter 2021 cases finally showing up, but until positives jump, cases will likely flatten.
* While cases are rising, hospitalizations are flat as a pancake as the next 2 slides will show
* Cases finally starting to rise but growth may be short lived
* Houston may be percolating, while ELP & AMA have peaked
* Widespread immunity? Looks that way right now
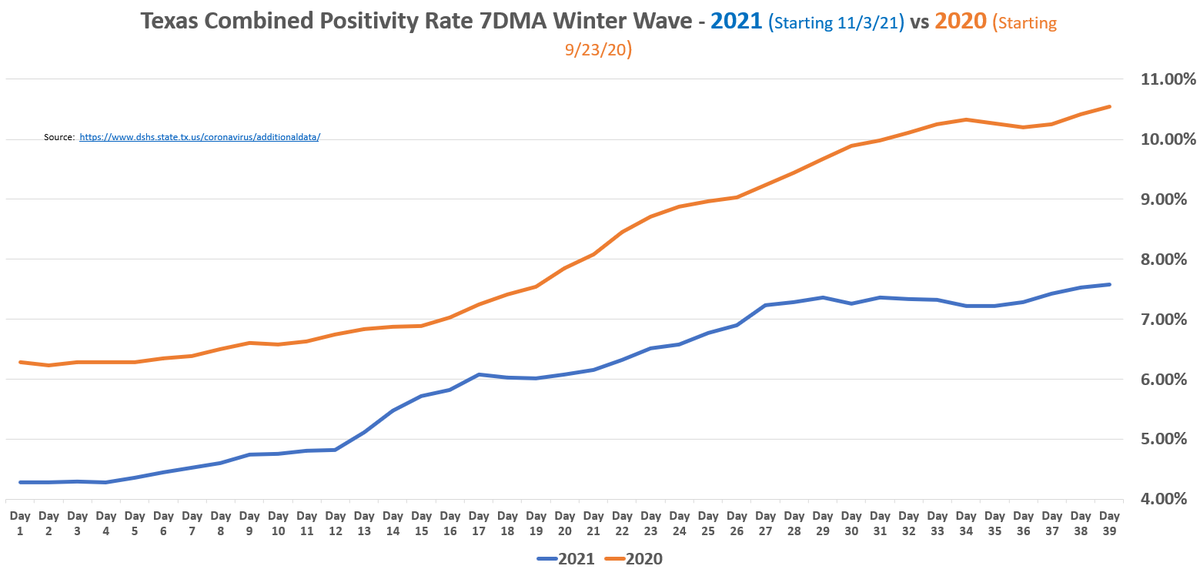
* Winter 2020 wave continues to leave 2021 in the dust
Tests filed by date of specimen collection, < 8 days old is incomplete
As of 12/6:
* Pos rate flat @ 7.20% & will stay flat for a few days
* With Testing flat @ 90K/day, means Positives are flat
* New Chart comparing Positives to Cases!
* Covidestim Rt 1.18
2/n .
12/16 - Cases
* Cases are batched by date received by the county
* Winter 2021 in a slow climb, but likely flattening in coming days.
* 2nd new chart comparing Positives to Cases, this one for the entire pandemic. Positives lead, then Cases, then conversion % trails
* Feel like I'm waiting on a wave that isn't coming
* Paddling on my surfboard in a calm ocean, might be time to paddle to shore and go home
* Widespread immunity? Starting to look that way
* Winter 2021 vs 2020 LOL
Tests filed by date of specimen collection, < 7-8 days old is incomplete
As of 12/4:
* Positivity rate really flattening, at 7.29%. Upcoming days are same
* Testing starting to flatten ~90K per day
* Cases will start flattening as well
* Covidestim Rt 1.18
2/n .
12/14 - Cases
* Cases are batched by date received by the county
* Winter 2021 in a slow climb, but likely flattening in coming days.
* 2021 Winter wave vs 2020, both positivity and cases, isn't comparable right now. -3 full points, and -3K cases.
Census & Rates of growth for Panhandle and Far West TX.
AMA is ahead of LBB. ELP is ahead of MAF. 1 of 2 things happening:
1) Spread is moving South & East. Or 2) AMA & ELP both saw much smaller Summer 2021 waves than LBB & MAF. An immunity question opposed to geography
2/n .
Looking at the Big Metros on the East and South sides, there is little growth right now. DFW & SAT generally single digit growth, AUS showing some in recent days, HOU still negative growth.
These cities are the big drivers of hosp numbers so we will need to be watchin
* Moderate spread in the North, still virtually none in the Southern part of the state
* Widespread immunity?
* Winter 2021 vs 2020 are barely comparable
* Same story, different day
Tests filed by date of specimen collection, < 7-8 days old is incomplete
As of 12/2:
* Positivity rate flat at 7.21%
* Testing recovered to 85K per day, looks to be climbing
* Should mean more positives and cases in upcoming days
* Covidestim Rt 1.15
2/n .
12/12 - Cases
* Cases are batched by date received by the county
* Winter 2021 starting a slow climb. Should be an increasing number of cases out there
* 2020 Winter wave was about to really explode at this point, two days from now. Will 2021? TBD but likely no.