A few tweets on how we treat absence of evidence and neutrality of science.
Building in a sense from this excellent @slatestarcodex blog astralcodexten.substack.com/p/the-phrase-n…
Building in a sense from this excellent @slatestarcodex blog astralcodexten.substack.com/p/the-phrase-n…
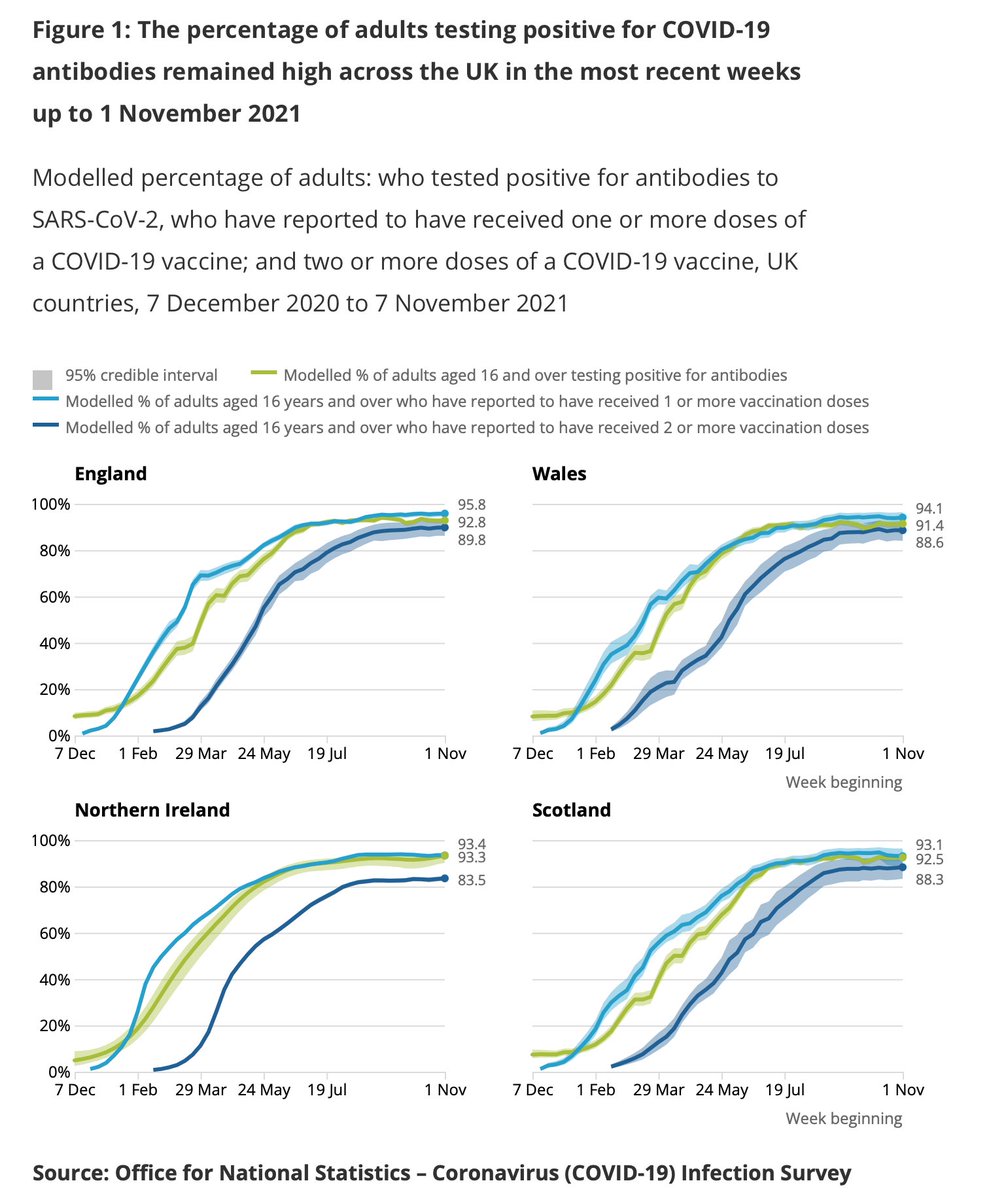
When omicron appeared we knew v little save for some of its genomic features and fact that it was spreading fast in S Africa.
Ensuing weeks have been unsettling because the virus has spread faster than our ability to understand key features - eg virility & vaccine resistance
Ensuing weeks have been unsettling because the virus has spread faster than our ability to understand key features - eg virility & vaccine resistance
Up until quite recently there has been a consistent message from public health officials:
a) we know boosters work. So much so that, says @SajidJavid, 3x doses will soon be considered a "full course" eg not two
b) there's "no evidence" omicron is necessarily milder/less virulent
a) we know boosters work. So much so that, says @SajidJavid, 3x doses will soon be considered a "full course" eg not two
b) there's "no evidence" omicron is necessarily milder/less virulent
But here's the thing. Even when those messages were being pushed we did have some hints in the evidence that:
a) booster effectiveness may wane and may be only a wee bit more effective than 2x doses of mRNA 👇
b) And S African studies suggested omicron may be milder.
a) booster effectiveness may wane and may be only a wee bit more effective than 2x doses of mRNA 👇
b) And S African studies suggested omicron may be milder.
https://twitter.com/EdConwaySky/status/1469383604828520451
Yet the way epidemiologists have amplified those "absences of evidence" has not been equal.
"No evidence" of omicron mildness is given so much emphasis it ends up on front pages.
"No evidence" that boosters will give more lasting protection vs omicron than dose 2 is minimised.
"No evidence" of omicron mildness is given so much emphasis it ends up on front pages.
"No evidence" that boosters will give more lasting protection vs omicron than dose 2 is minimised.

Yday we learnt via the latest @UKHSA update that as was already quite clear from SA data that omicron severity seems milder. Compare and contrast this week's update on this with last week's. Imperial flipped from emphasising absence of evidence re virility to evidence of mildness


But we also learnt that, as again seemed equally plausible despite "no evidence" a few weeks back, that booster VE does indeed wane about as fast as dose 2 with omicron.
Eg if you had mRNA vaccines it's less abt number of doses so much as when you had your latest dose
Eg if you had mRNA vaccines it's less abt number of doses so much as when you had your latest dose
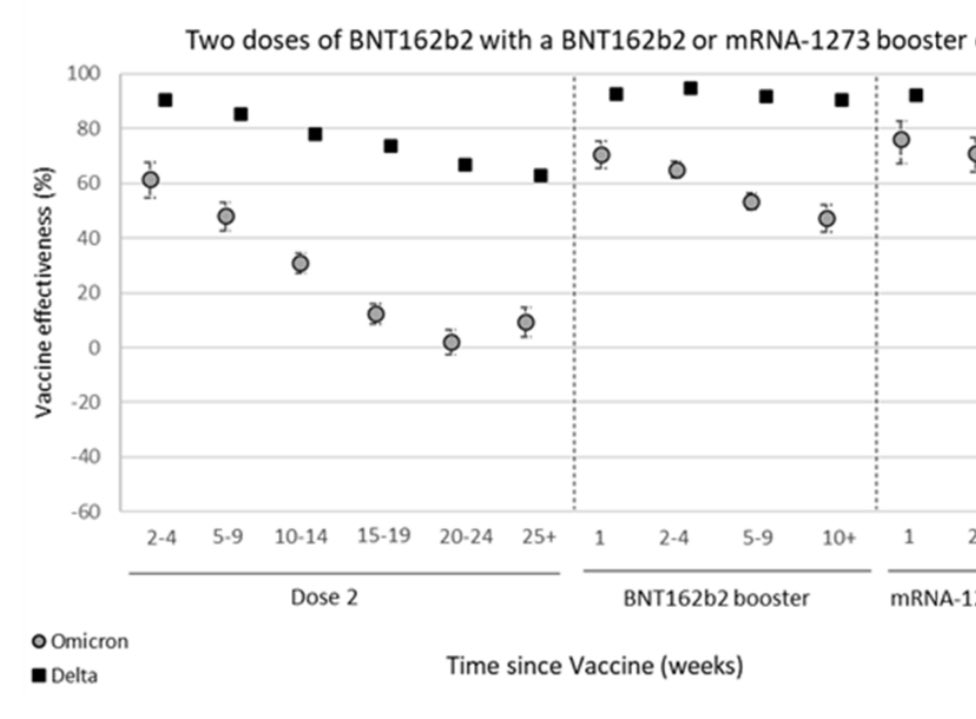
Another way of looking at it. Say 3x doses becomes a "full course". Someone who's had 2x Pfizer 2-4 weeks ago is a less likely to catch/spread omicron than someone who's had their booster 5-9 weeks ago. Yet only one of them will be considered fully vaxxed. Seems somewhat odd.

(True: VE ever so slightly higher with 3x doses. But enough to imply 3x is a full course while 2x is not? Surely not enough evidence.
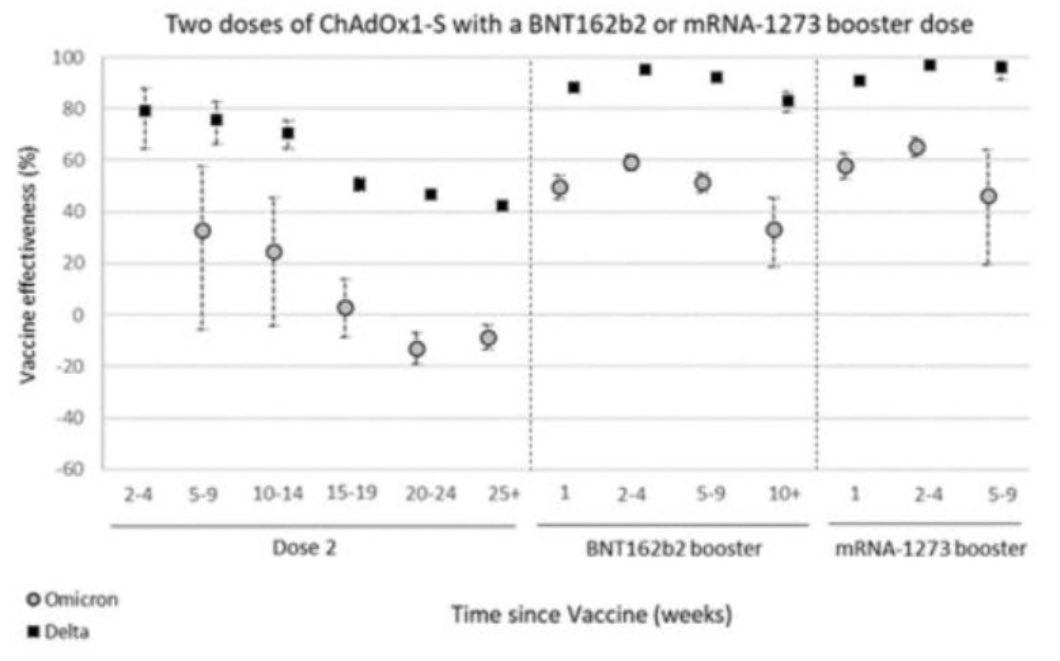
Also true: diff story for AZ. mRNA booster makes a big VE difference but largely because AZ not good at preventing omicron transmission full stop)
Also true: diff story for AZ. mRNA booster makes a big VE difference but largely because AZ not good at preventing omicron transmission full stop)
Now we can all understand why public health officials want to amplify "no evidence" of mildness but are less vocal abt "no evidence" of boosters being less effective than they've implied.
They have a mission to get people boosted!
Nitpicking like this is considered "unhelpful"
They have a mission to get people boosted!
Nitpicking like this is considered "unhelpful"
And for the majority of people, who had their second dose many months ago, that booster will indeed make a difference.
It should save lives.
So, from a public health perspective, this messaging makes sense.
But it raises a deeper issue about public health policy...
It should save lives.
So, from a public health perspective, this messaging makes sense.
But it raises a deeper issue about public health policy...
...while it wears the cloak of science it's not always entirely neutral about how it depicts the findings of that science.
Not for malign reasons!
Pub health officials have a duty to do EVERYTHING in their power to minimise the immediate mortality impact.
That's their JOB
Not for malign reasons!
Pub health officials have a duty to do EVERYTHING in their power to minimise the immediate mortality impact.
That's their JOB
And in a pandemic you might reasonably argue that one shouldn't be painstakingly neutral when the risks in one direction are skewed so far towards deaths.
Esp when you're fighting conspiracy theorists who genuinely do distort truth to sew fear about the vaccines.
Esp when you're fighting conspiracy theorists who genuinely do distort truth to sew fear about the vaccines.
I just worry that all of this could, long run, be damaging to trust in public health officialdom.
It comes back to something @FraserNelson has probed recently: the nature of the SPI-M modelling.
It too is not "neutral", skewed towards worst case scenarios.
It comes back to something @FraserNelson has probed recently: the nature of the SPI-M modelling.
It too is not "neutral", skewed towards worst case scenarios.
https://twitter.com/FraserNelson/status/1472300131110293515
That's shocking if you believe public health is inherently neutral re the evidence.
If on the other hand you believe it is inherently not neutral, inherently risk averse*, then it makes perfect sense.
* from a short term mortality perspective
If on the other hand you believe it is inherently not neutral, inherently risk averse*, then it makes perfect sense.
* from a short term mortality perspective
I'm left with some questions:
a) is it justified to skew one's depiction of scientific evidence ever so slightly if it will prob save lives?
b) if so, what are the long-run implications of doing so for faith in institutions?
c) ditto for non-pandemic public health
Any thoughts?
a) is it justified to skew one's depiction of scientific evidence ever so slightly if it will prob save lives?
b) if so, what are the long-run implications of doing so for faith in institutions?
c) ditto for non-pandemic public health
Any thoughts?
• • •
Missing some Tweet in this thread? You can try to
force a refresh