👁️Hidden Intel Trapped in Options Chain Data👁️
"Options are too mysterious."
- Said 99% of equity traders.
Sadly, the 99% don't realize that there is REAL JUICY ALPHA hidden in plain site if one just learns how to make sense of options chain data.
THE INTEL U WERE MISSING👇
🧵
"Options are too mysterious."
- Said 99% of equity traders.
Sadly, the 99% don't realize that there is REAL JUICY ALPHA hidden in plain site if one just learns how to make sense of options chain data.
THE INTEL U WERE MISSING👇
🧵

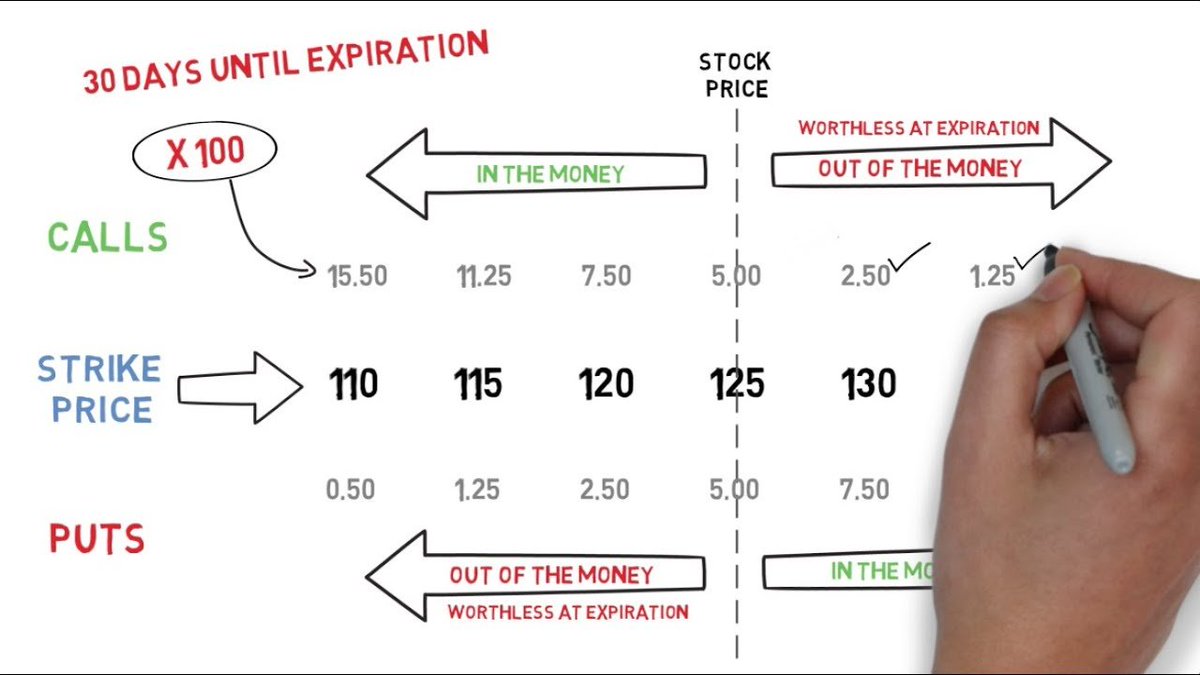
1/ Options reveal the market's thought distribution
When bad things happen (e.g. COVID, rate hike) people do 2 things:
1. panic sell stocks
2. panic buy puts
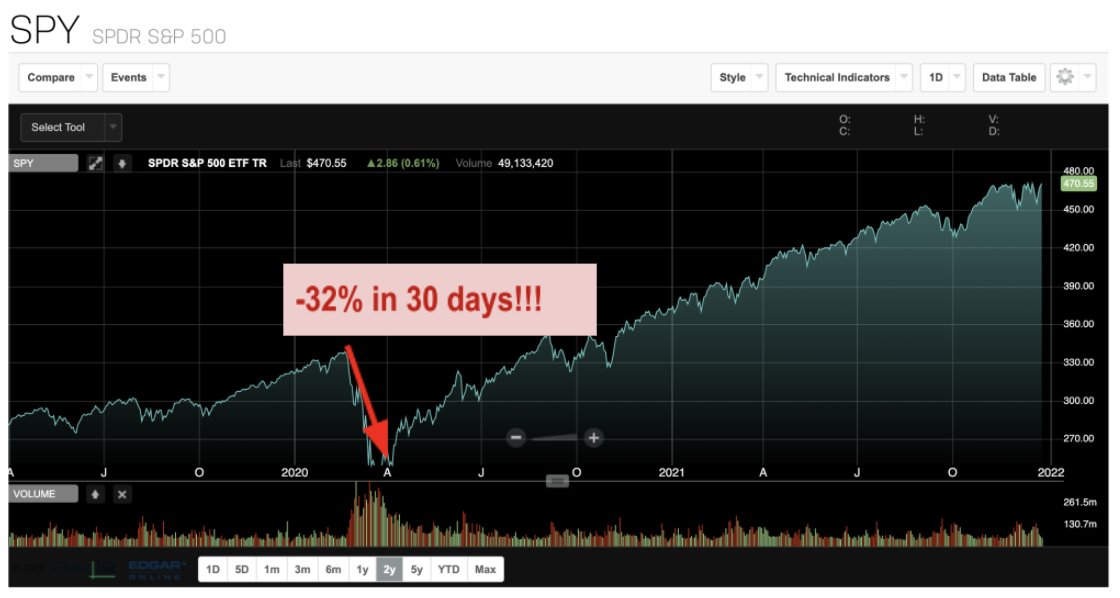
With only stock data, u might see "SPY dropped 32%!"
But u don't get any info on the DISTRIBUTION of peoples' views.
When bad things happen (e.g. COVID, rate hike) people do 2 things:
1. panic sell stocks
2. panic buy puts
With only stock data, u might see "SPY dropped 32%!"
But u don't get any info on the DISTRIBUTION of peoples' views.
How does put-buying volume compare after this event vs. under "normal" market conditions?
Does the increase in put interest following this event mirror a certain type of previous events (e.g. rate hikes) more so than others (e.g. refugee crisis)?
How long until mean reversion?
Does the increase in put interest following this event mirror a certain type of previous events (e.g. rate hikes) more so than others (e.g. refugee crisis)?
How long until mean reversion?

2/ Options reveal the intensity & confidence of the market's current view
Every stock has a "usual" implied vol (IV) curve.
Say u collect data on $AAPL's 30-day out at-the-money IV for 1 year straight, then plot it on a graph. U'd get some normal distribution w/ mean ~0.26
Every stock has a "usual" implied vol (IV) curve.
Say u collect data on $AAPL's 30-day out at-the-money IV for 1 year straight, then plot it on a graph. U'd get some normal distribution w/ mean ~0.26


Say u do the same exercise for $TSLA (30 day out, ATM IV). You'd get a skewed-right distribution rather than normal (since TSLA has way more "shock" news events than AAPL) & much higher mean ~0.60 (since TSLA on avg is a more volatile stock) & much wider standard deviation.


Let's break down the big ideas that these 2 examples illustrate:
- when the market knows how to price a stock (fairly), avg IV is lower (0.26 < 0.60)
- when the market is more confused than usual about how to price a stock given XYZ news, IV blows out past 90th/95th percentile
- when the market knows how to price a stock (fairly), avg IV is lower (0.26 < 0.60)
- when the market is more confused than usual about how to price a stock given XYZ news, IV blows out past 90th/95th percentile
3/ Historical options chain data reveals when IV is overpriced (i.e. when you should sell vol because the whole options chain is too expensive!)
If current IV for Jan 21 $1060-strike TSLA puts is 0.61, is that too rich? The way to tell is by calculating the percentile of 0.61.
If current IV for Jan 21 $1060-strike TSLA puts is 0.61, is that too rich? The way to tell is by calculating the percentile of 0.61.

4/ Options data reveals what the market predicts a stock will trade at on future dates
Have you ever wanted to ask the market:
"Hey what do y'all think TSLA will be on March 18?"
or maybe "How many of y'all think TSLA will be >1200 on March 18?"
Well the market has answered.
Have you ever wanted to ask the market:
"Hey what do y'all think TSLA will be on March 18?"
or maybe "How many of y'all think TSLA will be >1200 on March 18?"
Well the market has answered.

Key takeaways (& how to read) the above graphs:
- Looking at Dec 31, options-implied fair value of TSLA is equal to spot (duh, nobody expects it to move too much in 5 days)
- Looking at Jan 21 (1 month forward) options buyers are bearish; think fair value is closer to $1000
- Looking at Dec 31, options-implied fair value of TSLA is equal to spot (duh, nobody expects it to move too much in 5 days)
- Looking at Jan 21 (1 month forward) options buyers are bearish; think fair value is closer to $1000
5/ Options data reveals disagreement between call buyer/sellers and put buyer/sellers (this could be an indication of the magnitude of disagreement between bulls & bears)
See below how on Jan 21 the blue curve has a lower median than the red? Put buyer/sellers are more bearish.
See below how on Jan 21 the blue curve has a lower median than the red? Put buyer/sellers are more bearish.

Note: the graphs u see above aren't just publicly available data.
I derived the market's implied price at each options series' expiry date using 2 methods:
1. Breeden-Litzenberger
2. "Butterfly" method
@robertmartin88 has an awesome blog post on this:
bit.ly/32CgN67
I derived the market's implied price at each options series' expiry date using 2 methods:
1. Breeden-Litzenberger
2. "Butterfly" method
@robertmartin88 has an awesome blog post on this:
bit.ly/32CgN67
6/ Since options reveals the market's implied probabilistic view on where ABC stock should trade, you can compare your own view against it to identify the CHEAPEST option series that'll yield the highest returns if your view turns out correct.

End/
This thread gave you a snapshot into
- how I trade options
- how I use options chain data to seek out deeper & more powerful intel from the market that stock data just misses entirely
If it was too advanced, here's my previous thread for beginners:
This thread gave you a snapshot into
- how I trade options
- how I use options chain data to seek out deeper & more powerful intel from the market that stock data just misses entirely
If it was too advanced, here's my previous thread for beginners:
https://twitter.com/FabiusMercurius/status/1472303173226283011
And of course, Merry Christmas!
🎅🧑🎄
(Translation: You have an entire weekend to brush up on options analysis before markets re-open! 🤣)
🎅🧑🎄
(Translation: You have an entire weekend to brush up on options analysis before markets re-open! 🤣)
• • •
Missing some Tweet in this thread? You can try to
force a refresh