Here's a few charts I'm looking at this week pulled from the #DirtyDozen.
1. Nasdaq New Highs - Lows dropped to levels earlier this month that typically coincide with a double-digit selloff.
However, the Qs only managed to drop approx. 7% peak to trough.
1. Nasdaq New Highs - Lows dropped to levels earlier this month that typically coincide with a double-digit selloff.
However, the Qs only managed to drop approx. 7% peak to trough.

2. Similarly, R3K % stocks > 50-day MAs are rebounding from oversold levels that typically mark intermediate bottoms. Again, despite the index being near highs.
I read this as short-term bullish as there's now a propensity we see a snapback in breadth which supports the trend⬆️
I read this as short-term bullish as there's now a propensity we see a snapback in breadth which supports the trend⬆️

3. We break down each market by its technical regime using the SQN (BullV, BullQ, Neutral, BearQ, BearV).
The most profitable markets for our style of position trading are blended Bull regimes (bullQ + neutral).
Here's an overview from our dashboard.
The most profitable markets for our style of position trading are blended Bull regimes (bullQ + neutral).
Here's an overview from our dashboard.

4. We have a tool that shows the forward avg returns for each asset per its current regime. Currently, the markets w/ the highest projected 20-day returns are $CL_Z $XHB $SMH and $QQQ. 


5. $MU is back nearing new highs following months of increasingly bearish sentiment.
The chart is building into an accelerating parabola. The next MM target is $124 a share. I wrote up the bull case for semis & $MU in Sep 20', which you can find here macro-ops.com/underwriting-t…
The chart is building into an accelerating parabola. The next MM target is $124 a share. I wrote up the bull case for semis & $MU in Sep 20', which you can find here macro-ops.com/underwriting-t…

6. If $EURUSD closes negative in Dec it'll be the 5th consecutive monthly bear bar. Past instances have shown a strong bullish bias over the following 12-months. 


7. My view is that the $DXY is setting up for a fade soon. One pair I'm looking at here is $GBPUSD. It just broke up and out from a 3-wave down wedge
• Speculators have crowded into shorts
• Yield spread oscillator turning up in favor of GBP
• Momentum turning up from flat
• Speculators have crowded into shorts
• Yield spread oscillator turning up in favor of GBP
• Momentum turning up from flat

8. Corn and related softs are starting to perk up again.
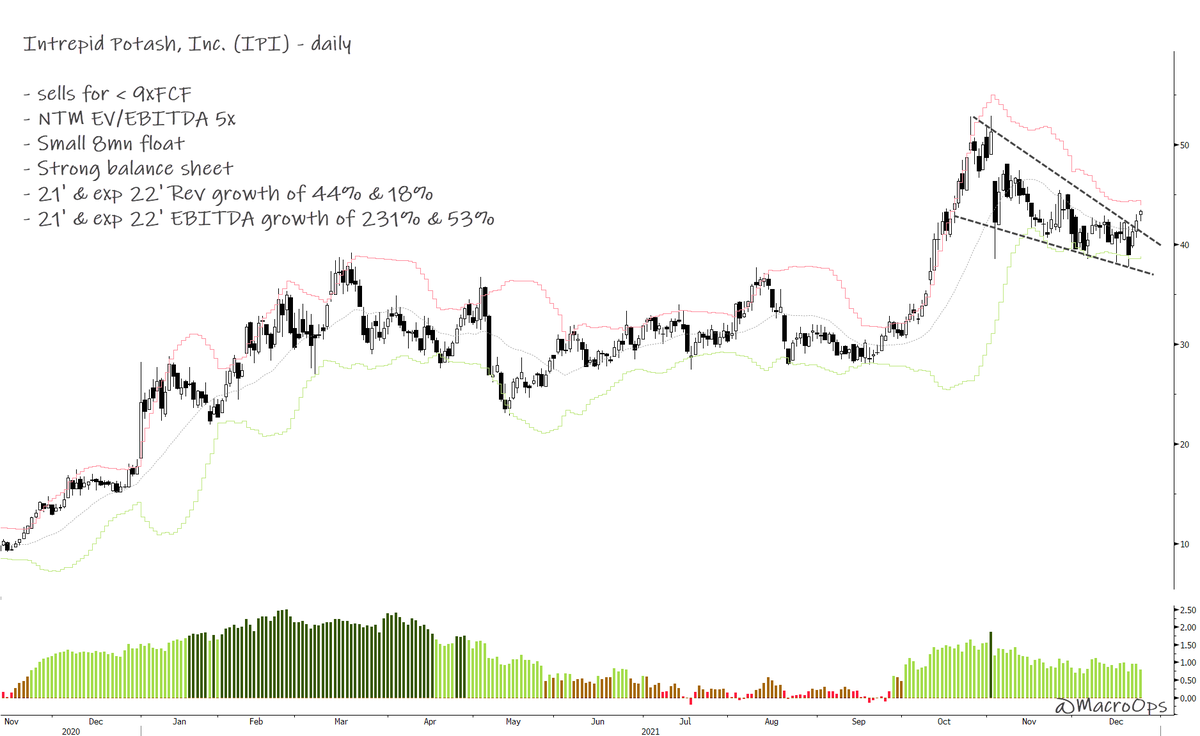
We're seeing similar strength in Ag related equity names. Two that we have positions in are (1) Intrepid Potash $IPI, which also benefits from higher oil prices thru its large water rights and $BIOX


We're seeing similar strength in Ag related equity names. Two that we have positions in are (1) Intrepid Potash $IPI, which also benefits from higher oil prices thru its large water rights and $BIOX


To sum up: the path of least resistance remains up
We're in the 3rd leg of a major Buy Climax. Climaxes tend to surprise w/ their durability
We have not yet triggered preconditions for a larger top
Stay safe & keep yo head on a swivel!
Read full note: macro-ops.com/a-stealth-bear…
We're in the 3rd leg of a major Buy Climax. Climaxes tend to surprise w/ their durability
We have not yet triggered preconditions for a larger top
Stay safe & keep yo head on a swivel!
Read full note: macro-ops.com/a-stealth-bear…
• • •
Missing some Tweet in this thread? You can try to
force a refresh


