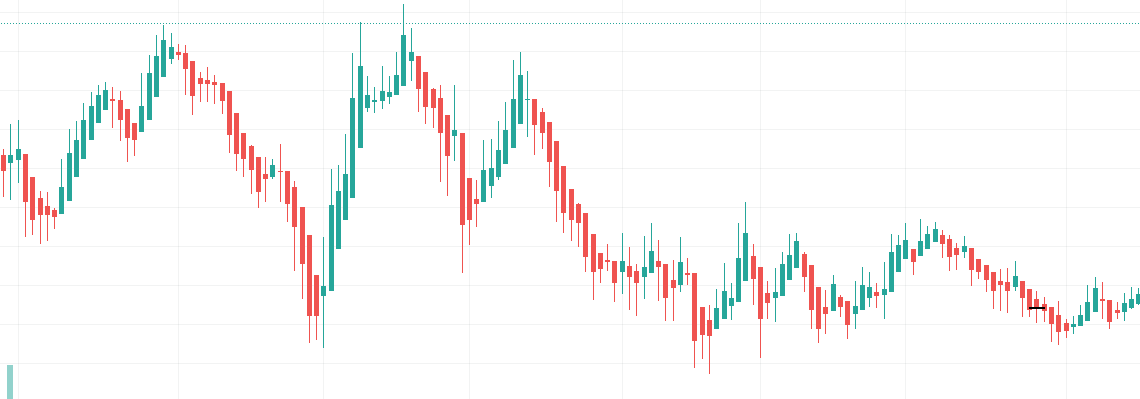
The Darvas Box Trading Strategy
A Detailed Thread 🔖 + 1 Book Give Away !
Rules For Giveaway :
Follow @JayneshKasliwal
🔄Retweet and
♥️ Like this Tweet
One Lucky Winner will be Selected in Live for the Giveaway
#StockMarket #darvasbox
A Detailed Thread 🔖 + 1 Book Give Away !
Rules For Giveaway :
Follow @JayneshKasliwal
🔄Retweet and
♥️ Like this Tweet
One Lucky Winner will be Selected in Live for the Giveaway
#StockMarket #darvasbox

About Darvas :
In the late 1950s, Nicolas Darvas was one half of the highest paid dance team in show business.
Darvas turned a $36,000 investment into more than $2.25 million in a three-year period.
1/n
In the late 1950s, Nicolas Darvas was one half of the highest paid dance team in show business.
Darvas turned a $36,000 investment into more than $2.25 million in a three-year period.
1/n
It was on a two-year tour of the world that he initially developed his ‘Darvas Box’ method of screening stocks – a method of picking stocks based on the stock’s price and volume .
Read more About his life : investopedia.com/articles/tradi…
2/n
@kuttrapali26
Read more About his life : investopedia.com/articles/tradi…
2/n
@kuttrapali26
Trading Style :
TREND FOLLOWING MOMENTUM TRADING
📌Darvas was tracking stocks only making new high
Trading stocks breaking 2-3 year high.
📌But 52-week high is mostly tracked for this theory
📌Emphasized very much on Huge volume Breakouts
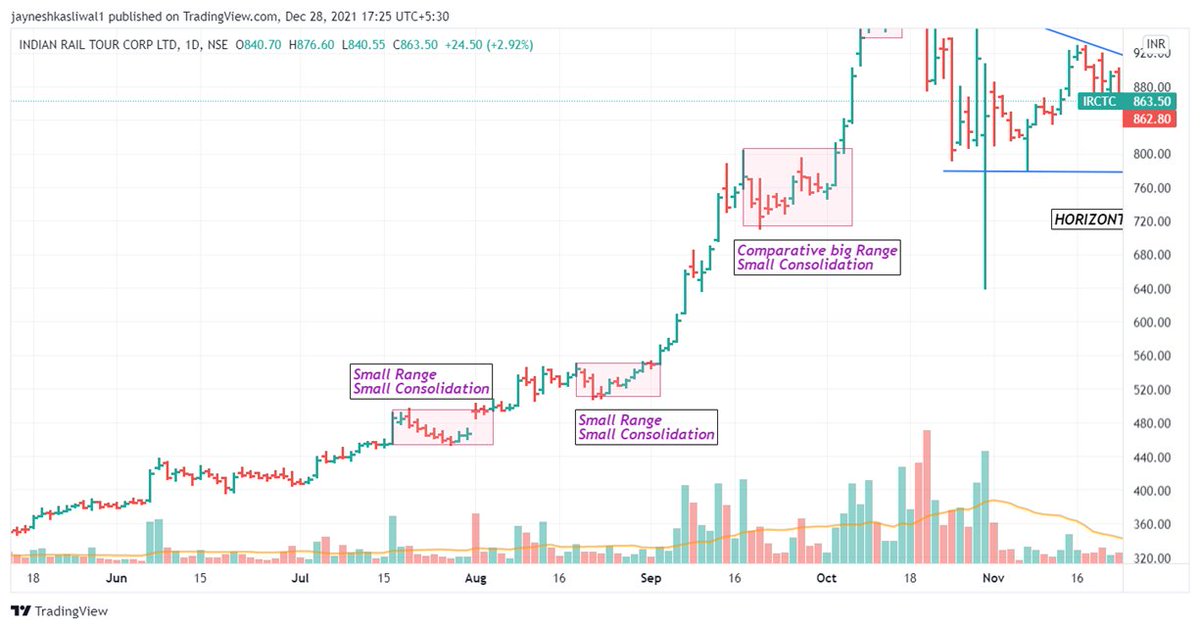
A typical Darvas Box Chart :
3/n
TREND FOLLOWING MOMENTUM TRADING
📌Darvas was tracking stocks only making new high
Trading stocks breaking 2-3 year high.
📌But 52-week high is mostly tracked for this theory
📌Emphasized very much on Huge volume Breakouts
A typical Darvas Box Chart :
3/n

Rules to Follow :
Stock Price Should be within 15 to 20 % of Highs
Overall trend of the stocks should be up and greater than 200 ema
Preferably 100% up then the 52 week low
Look for Industry Leaders , with High Growth
4/n
Stock Price Should be within 15 to 20 % of Highs
Overall trend of the stocks should be up and greater than 200 ema
Preferably 100% up then the 52 week low
Look for Industry Leaders , with High Growth
4/n
How to Trade ?
📌Whenever the stocks breaks the 52 week Keep them on watchlist
📌Look that The next 3 candles should not break the 52 week high and fall below
📌The high point will be called as CEILING
📌Look for Volume Breakout too or Breakout should be Above Average volume
4/n
📌Whenever the stocks breaks the 52 week Keep them on watchlist
📌Look that The next 3 candles should not break the 52 week high and fall below
📌The high point will be called as CEILING
📌Look for Volume Breakout too or Breakout should be Above Average volume
4/n
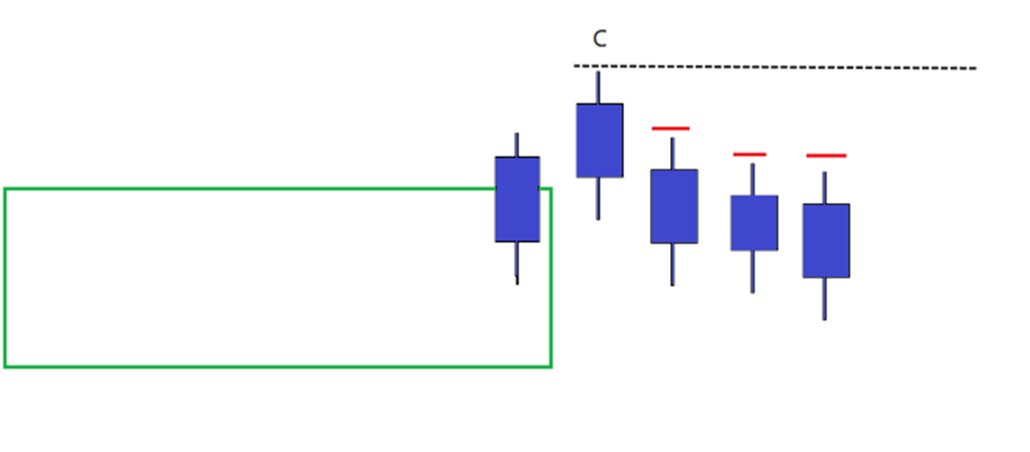
Floor: Stoploss
📌Floor is basically the a small reversal point or bottom the stock is trying to make.
📌Floor is generally the stoploss of the trade
📌The bigger the range the bigger the stoploss and higher the Risk
5/n

📌Floor is basically the a small reversal point or bottom the stock is trying to make.
📌Floor is generally the stoploss of the trade
📌The bigger the range the bigger the stoploss and higher the Risk
5/n


Example : #GREENPANEL
After 52 week High , mark the Top: Ceiling
After a small Reversal mark the Bottom : Floor
Enter As soon as the 52 week high breaks with stoploss
6/n
After 52 week High , mark the Top: Ceiling
After a small Reversal mark the Bottom : Floor
Enter As soon as the 52 week high breaks with stoploss
6/n

#RADICO #MANINFRA
✅Enter When 52 Week High is Broken , and Keep Adding as and when the box formation takes place .
🛑Keep Shifting the stoploss to next Box lows
7/n

✅Enter When 52 Week High is Broken , and Keep Adding as and when the box formation takes place .
🛑Keep Shifting the stoploss to next Box lows
7/n


PIC 1:
Entry on failed Breakout but Stops Dont hit as Stoploss is below the Box
PIC 2 : You should only draw boxes when the next 3 candles of 52 week high dont break the high.
8/n

Entry on failed Breakout but Stops Dont hit as Stoploss is below the Box
PIC 2 : You should only draw boxes when the next 3 candles of 52 week high dont break the high.
8/n


Parameters checked : #MINDAIND
#kotakbank : Not valid Box , as stock is not breaking the 52 week high only the range breakout is happening
Also Restrict yourself to growth stocks that is midcaps and smallcaps
9/n

#kotakbank : Not valid Box , as stock is not breaking the 52 week high only the range breakout is happening
Also Restrict yourself to growth stocks that is midcaps and smallcaps
9/n
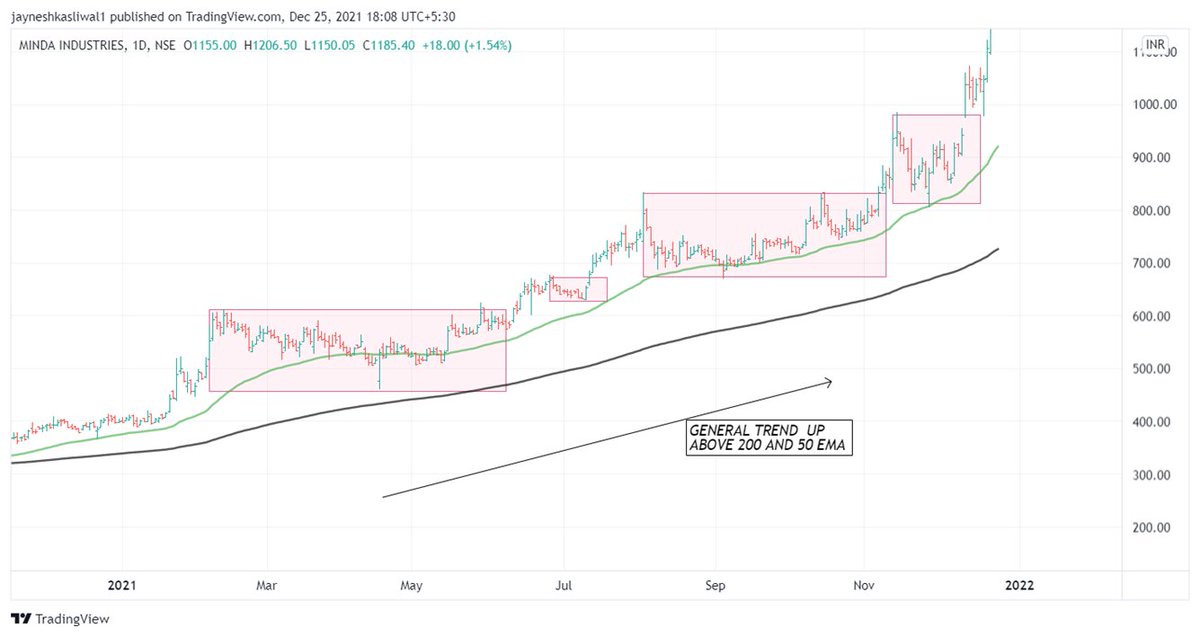

On monthly timeframe :
Riding the Winners #infy #tatamotors
He focussed on probabilty and riding the trend till a reversal sign is seen .
Small Stops are a price to pay for multibagger returns
10/n

Riding the Winners #infy #tatamotors
He focussed on probabilty and riding the trend till a reversal sign is seen .
Small Stops are a price to pay for multibagger returns
10/n


Time and % Differece of boxes :
There isnt any fixed % of difference from ceiling to floor mentioned any where
There also isnt any time frame mentioned how much the sideways trend or box formatiom will take place
There could be any combinations of boxes and there sizes
11/n
There isnt any fixed % of difference from ceiling to floor mentioned any where
There also isnt any time frame mentioned how much the sideways trend or box formatiom will take place
There could be any combinations of boxes and there sizes
11/n

Trailing Stop and Pyramiding
1. Buy if price closes above Ceiling and put a stop-loss below Floor price.
2. Add Small Qtys as breakout happens and one can pyramid in winners and further breakouts
3. Ride the winner till you get Stopped
4. Reenter if stock regains 52 wk high
13/
1. Buy if price closes above Ceiling and put a stop-loss below Floor price.
2. Add Small Qtys as breakout happens and one can pyramid in winners and further breakouts
3. Ride the winner till you get Stopped
4. Reenter if stock regains 52 wk high
13/

3. After the breakout of the box, if price moves higher and forms another box, then trail stop-loss to the Floor price of the newly formed box and keep trailing on each subsequent floor.
4.Exit the trade when price goes below the floor price of the recent box.
@AmitabhJha3
14/n

4.Exit the trade when price goes below the floor price of the recent box.
@AmitabhJha3
14/n


STOCK FUNDAMENTALS
Buy companies whose growth & earnings prospects look highly promising
Overall Market trend should be bullish
Stocks should be outperforming the general Market and should be leader
Breakout should be always on higher volume
Prefer Midcaps and Smallcaps
15/n
Buy companies whose growth & earnings prospects look highly promising
Overall Market trend should be bullish
Stocks should be outperforming the general Market and should be leader
Breakout should be always on higher volume
Prefer Midcaps and Smallcaps
15/n
Follow @Techno_Charts for Charts
Telegram Channel For Live session on Darvas Box
And t.me/Techno_charts
Telegram Channel For Live session on Darvas Box
And t.me/Techno_charts
• • •
Missing some Tweet in this thread? You can try to
force a refresh

