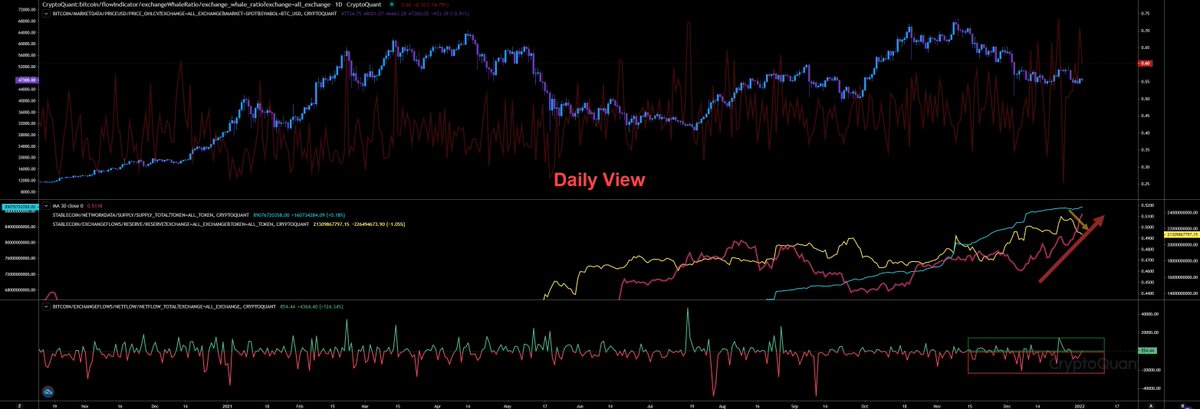
🚨🚨 Update: Our daily view is showing the (1) highest volatility in whales ratio since years. First it dumped hard indicating almost non tokens arriving by whales on exchanges, then it pumped hard indicating incoming whales inflows
#BTC #ETH #XRP
#BTC #ETH #XRP

and it dumped afterwards again. The (3) netflow chart is confirming those operations. First big outflows, big inflows afterwards and rising outflows later on again.
However, we had a total netflow of (minus) 2,666 BTC, indicating a bigger outflow from exchanges. Matches to the
However, we had a total netflow of (minus) 2,666 BTC, indicating a bigger outflow from exchanges. Matches to the
price action as the price has started to lift up again after reaching our local bottom at $45.7k yesterday.
The whales ratio 30d average (2) keeps rising indicating more inflows arriving exchanges, while the (yellow curve) stablecoin reserve on exchanges are declining indicating
The whales ratio 30d average (2) keeps rising indicating more inflows arriving exchanges, while the (yellow curve) stablecoin reserve on exchanges are declining indicating
more stablecoin withdraws from exchanges, but with a rising (blue curve) stablecoin supply in general indicating a rising stablecoin demand.
Our hourly view gives us a better understanding of what is happening right now. Our (1) whales ration maintains very high between a range
Our hourly view gives us a better understanding of what is happening right now. Our (1) whales ration maintains very high between a range

of 0.70 - 1.00 (max) indicating whales tokens arriving to exchanges constantly. As soon the whales ratio falls heading 0.70 we pump afterwards and as soon it starts to pump heading 1.00 we dump. Usually whales ratio isn’t that accurate. It just indicates whales inflows to
exchanges, but an inflow to exchange doesn’t mean that they sell immediately afterwards. They can sell hours later or even days.
Anyway we can let confirm our whales ratio observations with our netflow chart showing (2) two big positive netflows (more inflows than outflows) but
Anyway we can let confirm our whales ratio observations with our netflow chart showing (2) two big positive netflows (more inflows than outflows) but
four big negative netflows at the same time indicating more purchases. Two of them happend today and the last one happend last hour.
Our stablecoin chart is indicating less stablecoins on exchanges (5) since 12–25/12–29–2021 indicating more stablecoin withdraws on exchanges.
Our stablecoin chart is indicating less stablecoins on exchanges (5) since 12–25/12–29–2021 indicating more stablecoin withdraws on exchanges.
Stablecoin supply (4)keeps rising since 12–30–2021 indicating more stablecoin demand. Last but not least our (3) 30d average whales ratio on hourly basis showing a falling trend indicating the sell pressure is reducing since 01–02–2022.
We have almost $800m in stablecoins that leaved the exchanges since yesterday and almost $400m inflows to exchanges in the same period of time. That at least woud indicate different parties here being in action. Those selling their assets and withdrawing stablecoins afterwards

and those pushing the price up again with stablecoins buying the assets.
The total exhange reserves are falling more and more indicating big accumulation ops. We have reduced the reserves by 5,150 BTC since yesterdays Market Update, but we still have 9,500 BTC remaining from our last big inflows end of december.

Okex has declined its reserves by 300 BTC since yesterday. Also here we have almost 1,600 BTC still remaining on the exchange from our last big inflow from 12–31–2021. These tokens could be related to Huobi and Binance restriction for China Mainland holders due the crypto ban in

China.
Bitfinex has rised its reserves by another 200 BTC since yesterday. Bringing the remaining tokens to a total volume of 3,300 BTC since its inflows from 12–23–2021.
Bitfinex has rised its reserves by another 200 BTC since yesterday. Bringing the remaining tokens to a total volume of 3,300 BTC since its inflows from 12–23–2021.

Gemini was rising its reserves since EoY but reducing the reserves again. Since yesterday another 1,250 BTC has gone. However, also here keep in mind, we still have 6,450 BTC remaining there since their inflows from 12–21–2021.

Binance, the main driver of the dump phase. The only exchange that received a big amount of all inflows. It reduced its reserves again by 1,350 BTC since yesterday. While it had received almost 45,000 BTC between 12–23–2021 and 12–29–2021 it has recuced the remaining tokens from

that inflows to 33,150 BTC.
Option traders are trading the coming 28Jan2022 expiry and indicating big volume in calls. In the last 24h they traded options at $60k and $48k and even the Buy/Sell Volume (24h) showing an expected trading range between $44k and $50k. The traded
Option traders are trading the coming 28Jan2022 expiry and indicating big volume in calls. In the last 24h they traded options at $60k and $48k and even the Buy/Sell Volume (24h) showing an expected trading range between $44k and $50k. The traded

volume for this price range wasn’t that big, so maybe a good trend indicator, but at the moment too early to let us make any prediction related to a price level for end of the month.
That’s actually wondering me a bit. The volume for derivates within 24h isn’t that high. In the past we had daily volumes of almost $78b while at the moment at $66.5b. Also the Open Interest isn’t that high either. Spot market doing very well and maintaing it’s $35b — $40b range.

Checking the BTC Long/Short ratio and the funding rates it seems, the funding rates are flipping now back to bullish. That would also explain why we have pumped today. But since the last hour more longs are arriving, so funding rates will shift back to bullish again.


If we check our Future Data on hourly view we can see that traders are gabling again using (2) high leverage futures. The Leverage Ratio has rised a lot since 12–07–2021 and it doesn’t stop. While (1) funding rates looks neutral. Due the last pump they liquidated some (3) shorts,

but also nothing big.
Additional Informations
SPX and DXY looks solid at the moment. SPX has its bearish day and I would expect more dump at least heading its support at 4768 while DXY is back on track after its deviation.
SPX and DXY looks solid at the moment. SPX has its bearish day and I would expect more dump at least heading its support at 4768 while DXY is back on track after its deviation.
Dates you should have in mind the next 2 weeks because they can have an impact to $DXY and $SPX, so also to crypto.

Personal Conclusion
The market keeps showing weak. We still have more incoming tokens by whales, even if they don’t send the same volume as in december, we still detect a lot of tokens on exchanges. We have stablecoins leaving the exchanges indicating whales selling their assets
The market keeps showing weak. We still have more incoming tokens by whales, even if they don’t send the same volume as in december, we still detect a lot of tokens on exchanges. We have stablecoins leaving the exchanges indicating whales selling their assets
At least that indicates their are preparing to buy the dip as the stablecoin supply didn’t decline yet. They hold stablecoin now, but didn’t send those back to treasury to convert in fiat. Only if the stablecoin supply start to fall while the exchange reserve of stablecoins
decline at the same time I would start to cry. At the moment it looks like they are preparing to buy the next big dip.
The only thing that doesn’t look great at the moment related to derivates is the leverage ratio imo. That let us rise the volatility to rekt all those high/1
The only thing that doesn’t look great at the moment related to derivates is the leverage ratio imo. That let us rise the volatility to rekt all those high/1
leverage shorts and longs. That would also explain why option traders are expecting a rising volatility and maximizing their risk management with long gamma./2
So, as usual make your own trade strategy. These informations should help you to make your own conclusions and develop your own trade strategy. Detect your entry and exit(s) and always stick to your plan. Don’t let you guide by fear or by price action./3
• • •
Missing some Tweet in this thread? You can try to
force a refresh