What if the recent dumps are related to the spot ETF rejection by SEC from November 12th? At least that could explain why #Bitfinex placed walls in the range of $38k - $46k. If so, that wouldn't be that bearish.

@SBF_FTX comments from your part?

#BTC #ETH #XRP
Details:
Institutionals dumping the price in May to accumulate and prepare the launch or their Spot ETFs. China FUD as trigger to let retailers sell their tokens. When everybody was expecting the big dump to lower ranges 07-21-2021 #FTX starts to buy and pumped the price up
init a new rally heading upper 40s/50s. More China FUD follows to get more tokens from retailers. FOMOying with incoming Spot ETF to rise the price up and reach new ATH. November 12th SEC announcing their rejection citing concerns about the lack of regulation and the potential
for fraud and manipulation in the bitcoin market. We start to dump.

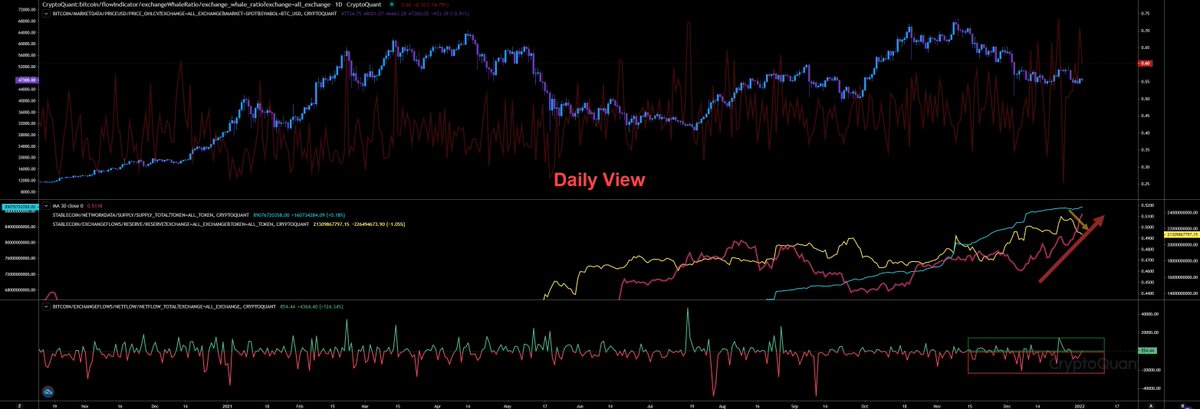
What you think folks? Makes sense? If not, drop your comment below and let us exchange some ideas. The daily analysis will be tweeted next. Need more time for that. 😜

• • •

Missing some Tweet in this thread? You can try to force a refresh
 

Keep Current with InspoCrypto

InspoCrypto Profile picture

Stay in touch and get notified when new unrolls are available from this author!

Read all threads

This Thread may be Removed Anytime!

PDF

Twitter may remove this content at anytime! Save it as PDF for later use!

Try unrolling a thread yourself!

how to unroll video
  1. Follow @ThreadReaderApp to mention us!

  2. From a Twitter thread mention us with a keyword "unroll"
@threadreaderapp unroll

Practice here first or read more on our help page!

More from @InspoCrypto

5 Jan
🚨🚨 Update: Today a quick market update as nothing have changed since yesterday. We still detect more incoming inflows from whales. The whales ratio maintains its level between 0.7 - 1.0. As soon we register bigger outflows, more inflows follows. Today we have

#BTC #ETH #XRP Image
registered more inflows than outflows. The stablecoin reserves on exchanges has rised a bit. I have received some whale alerts related to new stablecoin inflows to exchanges, but we have more outflows coming from #Binance again. Almost $510m stablecoin withdraw registered from Image
#Binance indicating whales selling their assets and withdrawn their stablecoins. If we don't detect some big inflows to treasury soon its almost confirmed that these whales want to stay to stablecoins to buy the dip afterwards. We have also detected $400m stablecoin inflows
Read 15 tweets
4 Jan
🚨🚨 Update: Our daily view is showing the (1) highest volatility in whales ratio since years. First it dumped hard indicating almost non tokens arriving by whales on exchanges, then it pumped hard indicating incoming whales inflows

#BTC #ETH #XRP
and it dumped afterwards again. The (3) netflow chart is confirming those operations. First big outflows, big inflows afterwards and rising outflows later on again.
However, we had a total netflow of (minus) 2,666 BTC, indicating a bigger outflow from exchanges. Matches to the
price action as the price has started to lift up again after reaching our local bottom at $45.7k yesterday.

The whales ratio 30d average (2) keeps rising indicating more inflows arriving exchanges, while the (yellow curve) stablecoin reserve on exchanges are declining indicating
Read 28 tweets
3 Jan
🚨🚨 Update: Our daily view is still showing a rising whales ratio indicating more whales inflows arriving on exchanges. Our total exchanges netflow also showing a positive netflow on exchanges (more inflows than outflows) of almost 850 #BTC. Since end of december

#BTC #ETH #XRP
no more big inflows were detected. Also we can see a rising stablecoin supply but a declining stablecoin reserve on exchanges indicating more stablecoin outflows from exchanges. Also for me a sign, they are preparing a dip. As the stablecoin supply keeps rising no big volume
in stablecoins are arriving the treasury. So, not that bearish. However, that would also indicate, we are not done yet with our dumps. That matches very well with my current expectations.

If we switch to our hourly view we can see that our whales ratio maintain very high since
Read 16 tweets
2 Jan
Sometimes to detect certain OTC activity I usually use the Total Tokens tranferred on netwok indicator combined with the exchange counts indicators. Together they can show you potential OTC activity. The August pump was driven by #FTX and my theory is, the

#BTC #ETH #XRP
rise of activity outside of exchanges (potential OTC, darknet, etc.) in August happen because #FTX huge transactions, a total of 40,000 #BTC. I have reported about that close after it happend. But the other 3 I have detected looks strange. They are related to dumps. Would be
interesting to know Genesis current data related to #BTC demand by institutionals. Because in their last report they mentioned that institutional demand is shifting from #BTC to #ETH. Until yet I thought our current dumps are related to the China mainland shut down, but what if
Read 6 tweets
2 Jan
🚨🚨 Update: Today just quick market view as no big changes happend since yesterday. We've started the year with extremely low volume, so also netflows no showing anything big.

Our hourly view shows a high whales ratio since the beginning of the new year.

#BTC #ETH #XRP Image
In the first 2 days we have detected to relatively big positive netflows, indicating more inflows than outflows to exchanges and one negative netflow in the beginning of the year. However, the netflow is showing us more inflows from whales are arriving to exchanges. The last big
netflow happend yesterday at 2 am (UTC +1) with almost 1,700 #BTC.

Also option trades didn't really change. At least nothing useful to let us predict certain price levels for January. Some of option traders have started to buy options for EoY 2022, their trade range between
Read 17 tweets
7 Oct 21
What is Inspos theory of what is happening with the market. Why did we pump #BTC July 21st?

Introduction: From May to June we had formed 3 different dead cat bounces with a LL support.

#BTC #ETH #XRP #Crypto #Analysis
Mid of June I have mentioned that I was expecting a shift to new lows as the market was reacting like in a re-distribution schematic, with poor quality rallies and only a rise in volatility in the beginning of the phase. But then June 26th something changed.
I have never understood what happend there. Now after months with more data and information in general, I think to know what let us flip from an uncoming dump to a new bottom to a quick accumulation from July 4th to July 20th. I have mentioned different times, that the pump
Read 20 tweets

Did Thread Reader help you today?

Support us! We are indie developers!


This site is made by just two indie developers on a laptop doing marketing, support and development! Read more about the story.

Become a Premium Member ($3/month or $30/year) and get exclusive features!

Become Premium

Too expensive? Make a small donation by buying us coffee ($5) or help with server cost ($10)

Donate via Paypal

Or Donate anonymously using crypto!

Ethereum

0xfe58350B80634f60Fa6Dc149a72b4DFbc17D341E copy

Bitcoin

3ATGMxNzCUFzxpMCHL5sWSt4DVtS8UqXpi copy

Thank you for your support!

Follow Us on Twitter!

:(