Good news from Ontario - the omicron "vaccine hole" seems to have a ceiling that's holding. There is still mild protection from vaccine, whereas ICU/hospitalization remains robust. (Updated today)

Suspect a portion is due to "who goes for tests."

/1
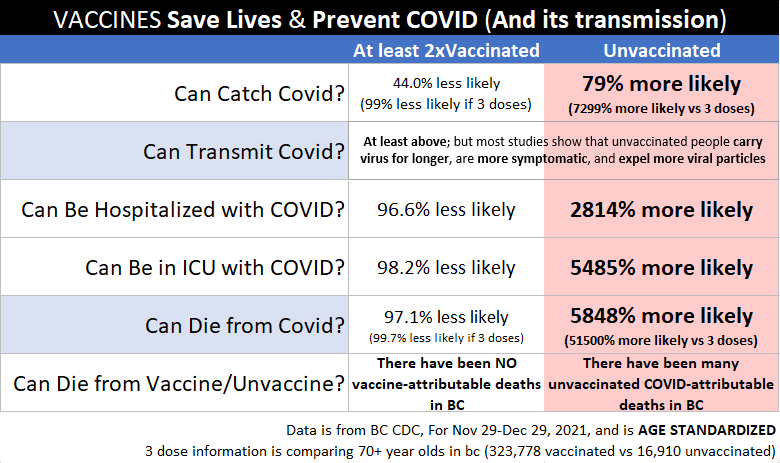
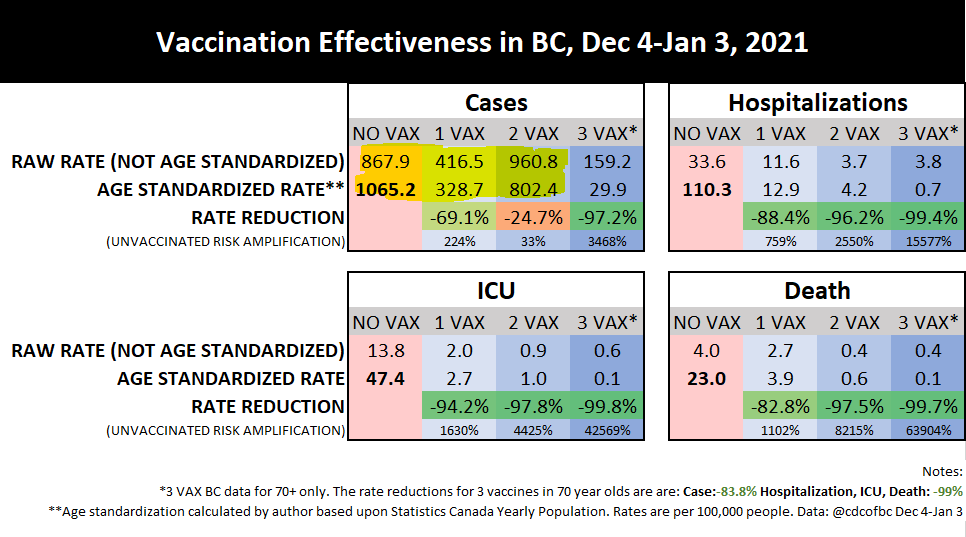
In BC, the variable of age plays large into the seemingly negative vaccine effectiveness. Age is such a massive variable that age standardization flips whether or not vaccines show effectiveness to reducing cases.

/2
While the monthly stats still look quite vaccine-protective, this is shifting rapidly and the past few days have seen higher rates of vaccine cases than unvax cases.

/3
Recent days have a blip where it appears that being vaccinated leads to a higher rate of infection than being infected.

I am sure this type of bias has a name (blanking on it), the "time window" bias. When our time frame is 1 day, yes, we see this.

/4
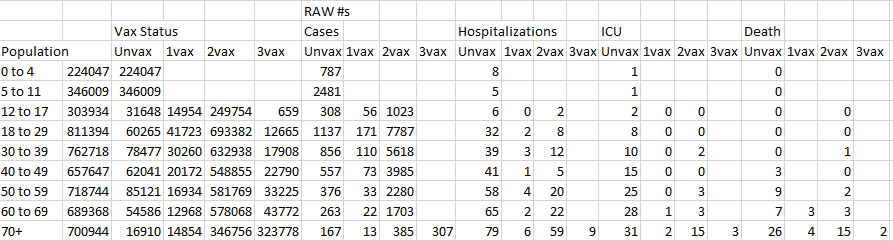
To show you why the story isn't as bleak as this graph suggests, let's recreate the graph in excel (AHHH @bccdc i had to type this in by hand it was soooooo annoying please let us download data!!! :) )

Here it is: July 1 2021 to Jan 3, 2022

/5
Now, lets change this to cumulative case rate.

I personally think that it is very unlikely that vaccinated case rates will overtake unvaccinated case rates, knowing that our vaccines ARE protective and have efficacy (Even waning) against Omicron.

/6
So likely, we will continue to see a dramatically lower (but positive) efficacy of vaccines than we're used to. We will see many more vaccinated cases of covid.

But vaccines still are preventative of infection overall, definitely remain protective of hospitalization & death.

/7
This effect is statistically very nunaced, so media people, please consult with statisticians! Don't look at the charts yourself!

a) vaccinated people and unvaccinated get TESTED at different rates
b) unvaccinated people have a much higher cumulative rate

/8
c) omicron reduces VE, so we will see more vaccinated people get covid

Good luck as we enter THIS murky phase.
Vaccine Effectiveness over time (cumulative)
Same plot, but using "daily rate"
both need to be taken together and understood in both the large context of vaccination, as well as what will happen when a "breakthrough variant" (with a lower VE) establishes dominance. We will see this shift.

• • •

Missing some Tweet in this thread? You can try to force a refresh
 

Keep Current with Tyler Black, MD

Tyler Black, MD Profile picture

Stay in touch and get notified when new unrolls are available from this author!

Read all threads

This Thread may be Removed Anytime!

PDF

Twitter may remove this content at anytime! Save it as PDF for later use!

Try unrolling a thread yourself!

how to unroll video
  1. Follow @ThreadReaderApp to mention us!

  2. From a Twitter thread mention us with a keyword "unroll"
@threadreaderapp unroll

Practice here first or read more on our help page!

More from @tylerblack32

8 Jan
Not to directly contradict a major society in Canada, but BC has not been experiencing a spike in suicidality, emergency mental health presentations, or severe MH admission rates during periods of school closure.

In Feb to May 2021, with schools fully open here, yes, yes we did.
This statement should give the society pause. Being a letter to Ontario govt, of course, it's Ontario centric (every Canadian organization is). But schools have been open for the entirety of the 2020 2021 year and closed for precisely 1 week (Jan 4 to 8, 2022).

Same spikes.
If we saw the same spikes in mental health challenges in 2020-2021 with schools open that Ontario saw with schools closed, what does that suggest?

We will be directly testing in school/out of school data here in BC, and actually publishing numbers that are peer reviewed.
Read 15 tweets
7 Jan
"Returning to school" solves NONE of the pre-pandemic mental health problems our kids, which were increasing and substantial. It is not the same world it was pre-pandemic, and we are all under pandemic pressure.

It is a fantasy to pretend like "returning" brings things back.
I mean... I get the fantasy. It's alluring. We all kinda wish we could go back to 2019 and just... you know... keep going there.

But we can't. Kids are under MORE pressure today, not less, and its not just 'missing school' (in fact, if you asked them...)

/2
It's 1.5 million kids worldwide being orphaned.

It's entire economies and ways of life shifting.

It's a postpandemic world that is mid-new-variant and another worse variant away from retreat.

/3
Read 7 tweets
6 Jan
/1 A great summary given by the @mehdirhasan regarding the rhetoric around schools, "trauma," & kids' mental health. I was so pleased to see these nuances injected into the conversation.

I'd like to talk about a different aspect, but please watch first!

/2 Wayyyyy back in July 2020 when schools were approaching I worked very hard to get the word out: schools are actually quite nuanced when it comes to kids' mental health. It still holds, and I'll be reiterating some of it here.

/3 How about this CDC data (I compiled/visualized) of # pediatric suicides per day? School days are associated with a 40-50% increase in suicides compared to non-school days.
Read 19 tweets
4 Jan
/1 =-=-=-=-=-=-=-
Thread: Mortality in 2020 and myths
=-=-=-=-=-=-=-

2020, unsurprisingly, came with excess death. There was an 18% increase in overall mortality, year on year.

But let's dive in a little bit deeper. The @CDCgov has updated WONDER, its mortality database.
/2 First, let's get you acquainted with my graph. It looks noisy because I wanted to give you the best data possible.

Graph: monthly rate of SUICIDE in the US, for every year going back to 1999. Teal represents 2019 and red 2020.
/3 I wanted you to see the trends, so there are 5 years 2014-2018 represented in the dark blue.

On the bottom, the summary of raw # of deaths 2019 vs 2020, and if this represents a significant difference (p<0.05)
Read 27 tweets
4 Jan
This graph is now dynamically created based upon the latest @CDCofBC dashboard. #vaccineswork, even in the last month of this awful pandemic.

#stats #covidbc #bcpoli #epitwitter

/1 Image
Vaccination effectiveness dashboard

/2 Image
Raw data from @CDCofBC Image
Read 5 tweets
31 Dec 21
Hi @FrontiersIn : A paper of yours (editor: @GetchellNancy) missed some very important (and honestly basic) statistical issues, and is contributing to a narrative that is not supported by the paper.

#twitterpeerreview
#reviewer2stepsinanddoesthejob
#statstwitter
The paper should have been challenged on review:

* why not iterate 1 year vs other 5 years for all years '16-20 (resolves all issues)
* why not challenge the finding in "communication at 1 year" increasing for 2020 when clearly the significance comes from the low 2017 #

/2
Had it done so, the conclusion of the paper would be markedly different: "2020 showed similar and expected fluctuations as has been seen in the prior 5 years in all domains," and it would not be used as evidence that "pandemic measures effects harm child development"

/3
Read 8 tweets

Did Thread Reader help you today?

Support us! We are indie developers!


This site is made by just two indie developers on a laptop doing marketing, support and development! Read more about the story.

Become a Premium Member ($3/month or $30/year) and get exclusive features!

Become Premium

Too expensive? Make a small donation by buying us coffee ($5) or help with server cost ($10)

Donate via Paypal

Or Donate anonymously using crypto!

Ethereum

0xfe58350B80634f60Fa6Dc149a72b4DFbc17D341E copy

Bitcoin

3ATGMxNzCUFzxpMCHL5sWSt4DVtS8UqXpi copy

Thank you for your support!

Follow Us on Twitter!

:(