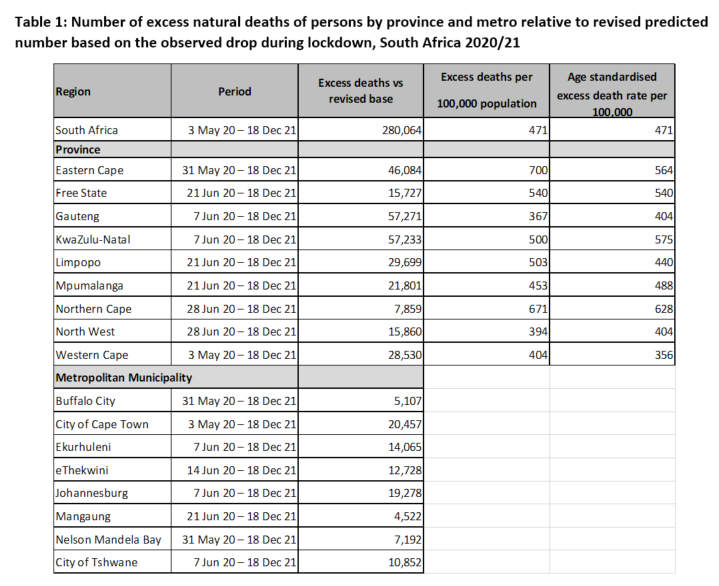
Latest @MRCza and @UCT_news report on excess mortality in South Africa, through 8Jan22, released.
290 000 excess deaths since 3May20. 3 150 in the most recent week (down from 3 300 the previous week). Report available here: samrc.ac.za/reports/report…
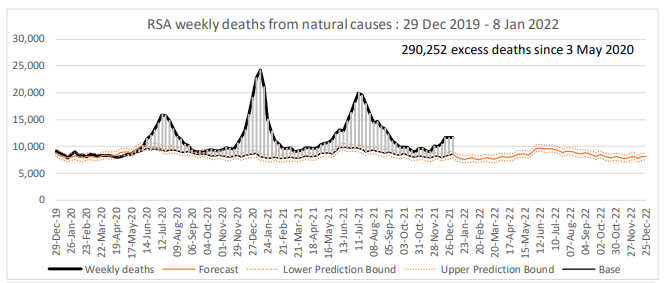
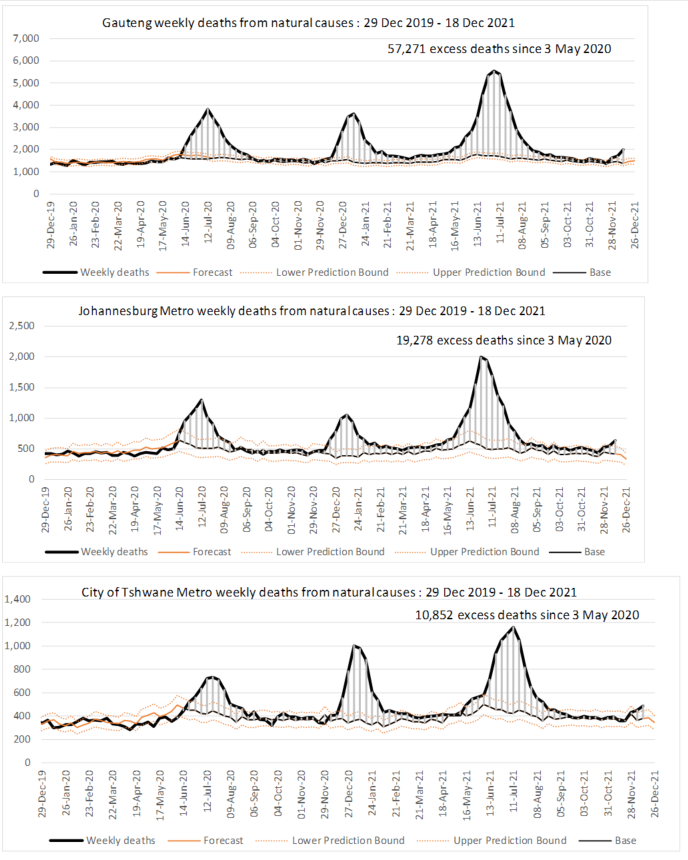
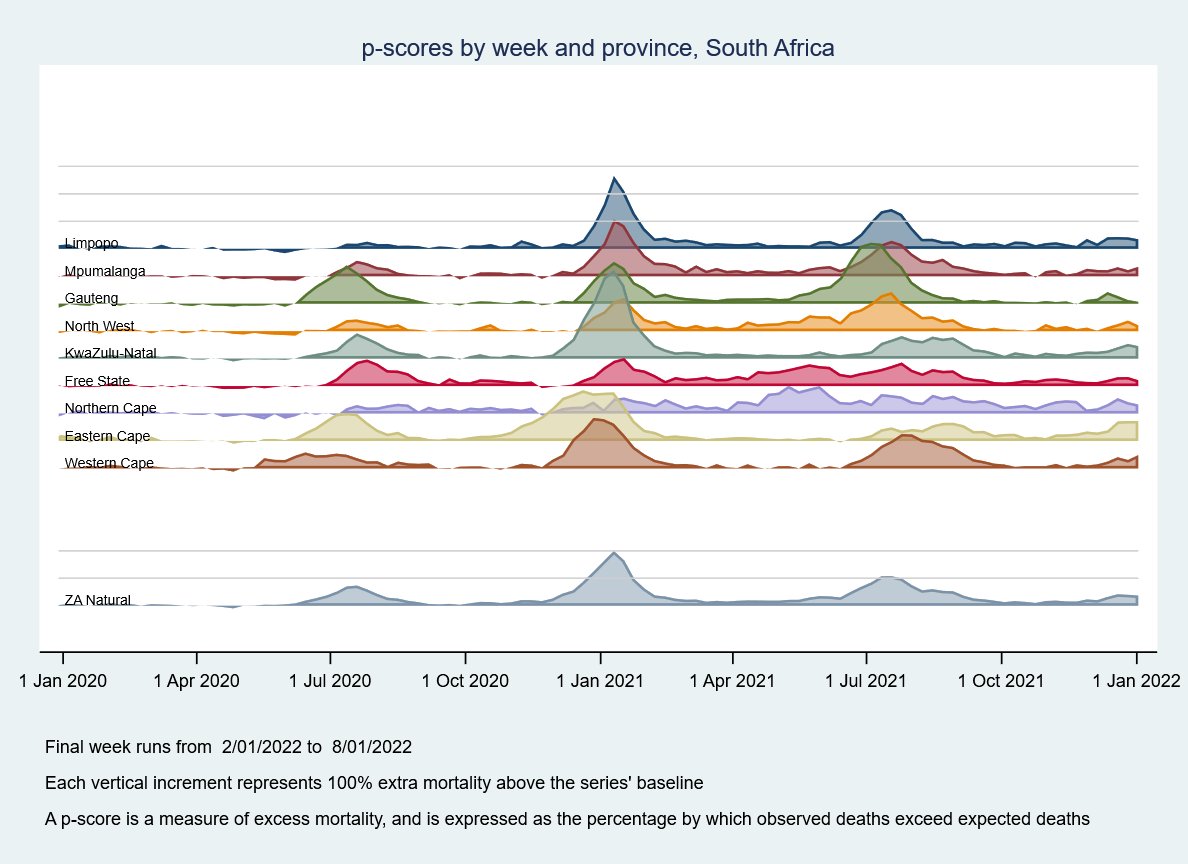
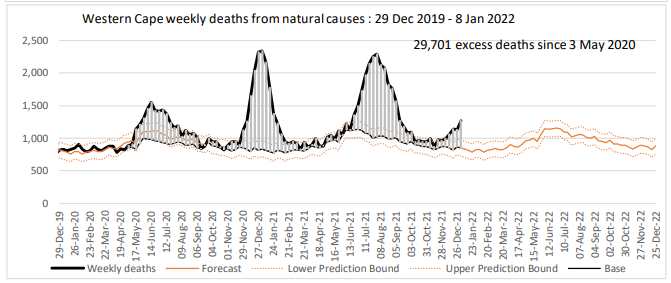
Nationally, excess natural mortality declined slightly in the most recent week: from 39.9% above expected to 37% above expected. Declines in every province other than Western Cape (up from 31 to 49% above expected) and Mpumalanga. Gauteng down to 7% above expected.
By age, excess mortality stabilised among those 70-79 and 80+; down in other groups
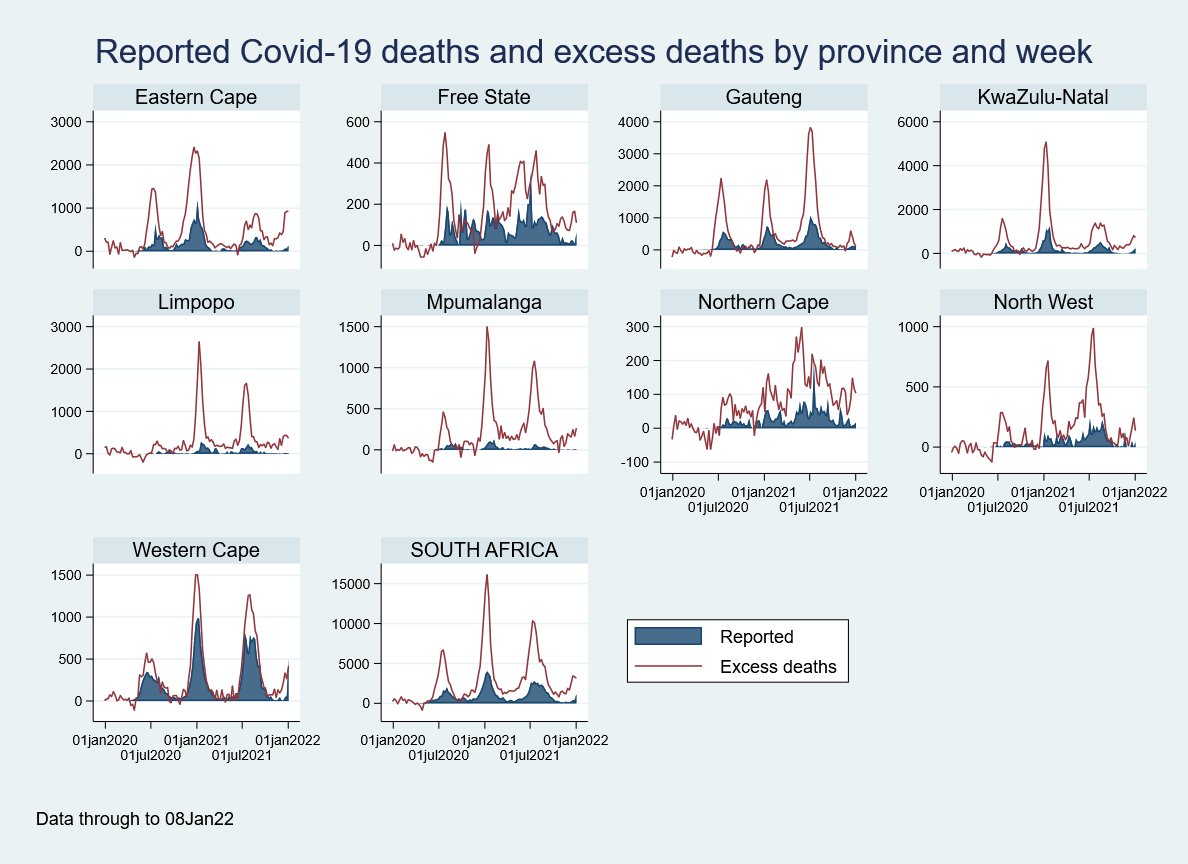
The effect of the late reporting of official Covid deaths on 6Jan22 is visible in the plot of excess deaths and reported deaths
Unnatural deaths continue tracking very closely to the expected level.
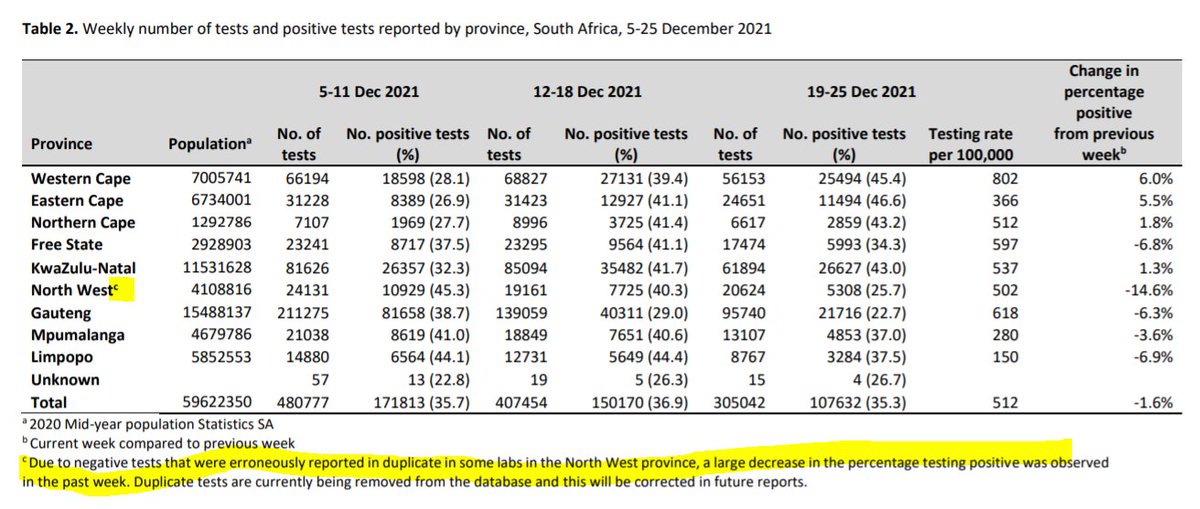
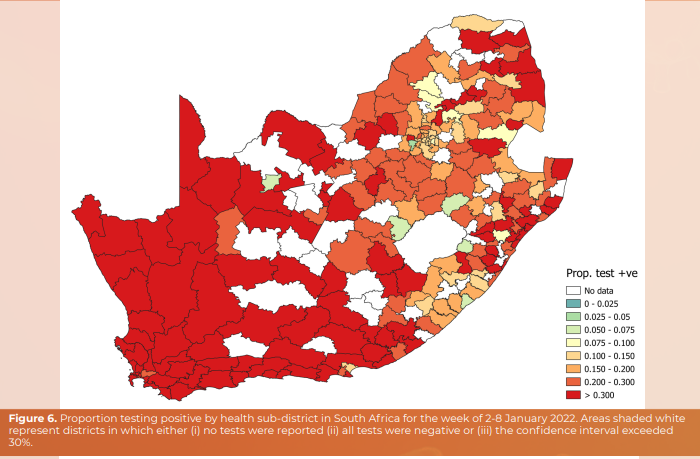
Also today, the most recent @nicd_sa report on testing for SARS-CoV-2. Report available here: nicd.ac.za/diseases-a-z-i…. Proportions testing positive down in every province; nationally down from 31% to 24%; but with a slower descent than ascent.
At a district level, 99 districts had a proportion testing positive (PTP) in excess of 30%, down from 127 last week.

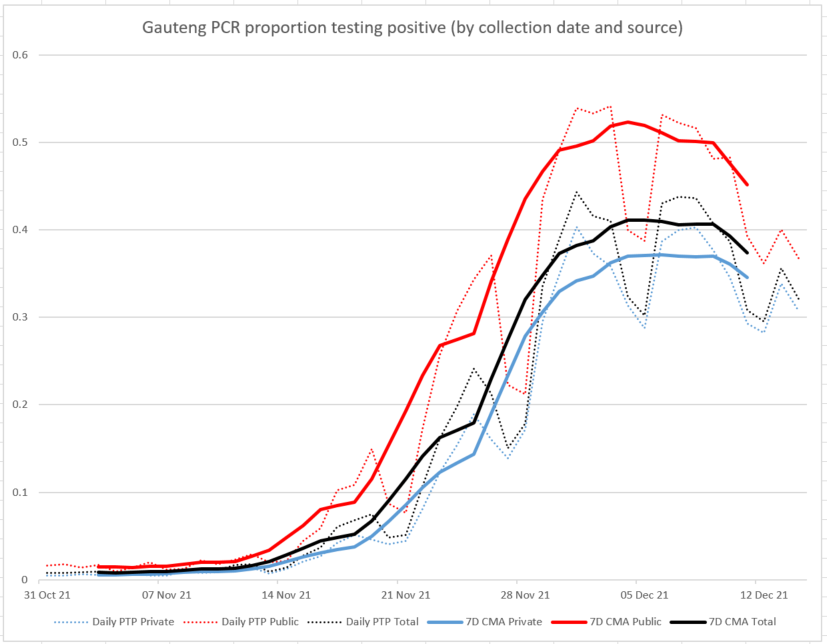
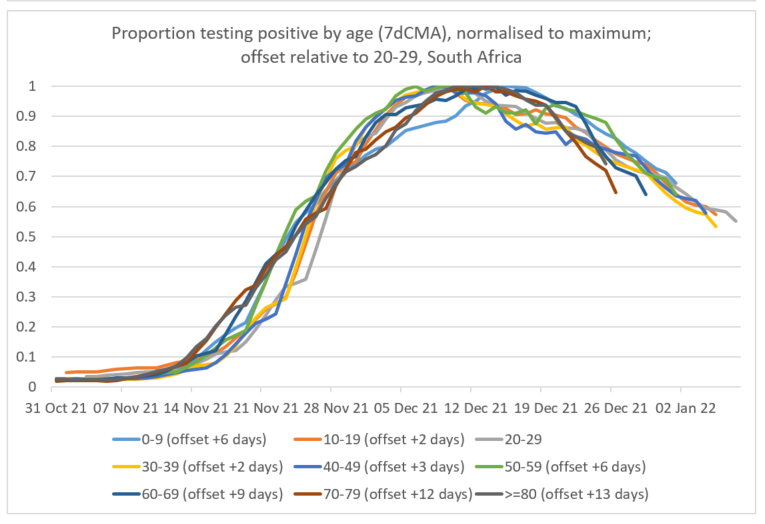
By age, PTP largely flat, but the end of the waves in every province at all ages is now evident.
The national evolution of PTP by age in the 4th wave is shown below; something to watch, though, is that the pace of decline may be faster amongst older segments of the population (when normalised and offset)
Combining the testing and excess deaths data, the very different pattern / decoupling of excess deaths and cases in the wave persists.
However, as noted last week, while deaths have remained low, hospitalisations have been lower than in previous waves, but not by as much as the deaths recorded in DatCov (data from sacmcepidemicexplorer.co.za)
Shorter durations of admission, and fewer cases outside of general wards (or requiring ventilation), have certainly helped prevent an overburdening of the health system.

As always; stay well; and stay safe.

• • •

Missing some Tweet in this thread? You can try to force a refresh
 

Keep Current with Tom Moultrie

Tom Moultrie Profile picture

Stay in touch and get notified when new unrolls are available from this author!

Read all threads

This Thread may be Removed Anytime!

PDF

Twitter may remove this content at anytime! Save it as PDF for later use!

Try unrolling a thread yourself!

how to unroll video
  1. Follow @ThreadReaderApp to mention us!

  2. From a Twitter thread mention us with a keyword "unroll"
@threadreaderapp unroll

Practice here first or read more on our help page!

More from @tomtom_m

5 Jan
Right. Back from leave and with a lot to report on wrt South African testing and death data! Apologies in advance for the length of the thread. BLUF: things generally looking positive.
2/ After a week’s hiatus the latest @mrcZA and @UCT_news weekly report on excess deaths in South Africa has been released. The report covers excess deaths in South Africa through 01Jan22, and is available here: samrc.ac.za/reports/report….
3/ A total of 286 000 excess natural deaths have been estimated since 03May20, 201 000 in 2021. We estimate 3 000 excess natural deaths in each of the last two weeks (ending 01Jan22 and 25Dec21), up from 2 500 in the week to 18Dec21.
Read 27 tweets
29 Dec 21
As flagged last week there is NO excess deaths report released this week. There were not many days in which deaths in the week to 25/12 could have been reported. Deaths in the week to 25/12 should have been reported this week, and will be included in the report next week.
On the testing side, proportions testing positive fell in many provinces.. But a data problem in NW last week, which saw duplicate negative results being loaded, means that that province's decline is exaggerated, as is (to a limited extent) the national figure.
The report is here: nicd.ac.za/wp-content/upl… National PTP 'fell' to 35.3% (see previous tweet for caveat). Gauteng fell from 29% to 22.7%. The WC, EC, NC and KZN all increased.
Read 6 tweets
27 Dec 21
Down-time for a few days.
Greys and blues Image
Blues and greens Image
Read 4 tweets
22 Dec 21
Latest @MRCza and @UCT_news report on excess deaths in South Africa released, covering the period to 18Dec21. 280 000 excess natural deaths (471/100 000) since 3May2020.
Report available here: samrc.ac.za/reports/report…
2/ Nationally, natural deaths were 33% above expected (the p-score), compared to 18% the previous week. 2 600 excess natural deaths in the most recent week (12-18Dec), up from 1500 the previous week.
70% of excess deaths were among those aged 60+.
3/ By province, excess deaths increased in Gauteng over the week (p-score up from 16 to 44%). Limpopo up from 19% to 47%. Deaths in Johannesburg was 53% above expected (last week 27%). But still FAR below the peaks in previous waves
Read 21 tweets
19 Dec 21
A series of mini-thoughts for a Sunday afternoon. South Africa vs. Rest of the World - the Omicron Edition.
1) We are pretty confident that Gauteng, the province at the South African Omicron epicentre is past its peak in terms of proportion of tests returning positive.
2) Despite massive number of cases (and incredibly high PTP: in the week to 11Dec, in Gauteng an ALL-TIME high of 38.7% - and an intra-week daily high of 41% when looking at PCR tests only), we have seen relatively few hospitalisations and deaths.
3) It really *does seem* as if South Africa, my country, will escape relatively unscathed in this wave.

None of that is particularly new. But other things gnaw at me.
Read 12 tweets
16 Dec 21
More on the turn in proportions testing positive in Gauteng (mentioned in last night's thread: ).
1. While we had suspected that the daily PTP had maxed out on 1 Dec, the clear periodicity in the data means that we had to wait to confirm
1b. We also had crashed into data problems of loaded data from public facilities, so had to split by public/private to be more certain that PTP in each had turned before calling it.
On top of that, the known issues with loading of Ag test results means focus must be on PCR tests.
1c. Weekly periodicity means that it's preferable to use a 7day centred moving average, and to wait until the daily peaks had moved out of the 7DCMA window to confirm. Adding another day's data (covering to 14/12) confirms the trend. NB! GAUTENG PCR ONLY
Read 9 tweets

Did Thread Reader help you today?

Support us! We are indie developers!


This site is made by just two indie developers on a laptop doing marketing, support and development! Read more about the story.

Become a Premium Member ($3/month or $30/year) and get exclusive features!

Become Premium

Too expensive? Make a small donation by buying us coffee ($5) or help with server cost ($10)

Donate via Paypal

Or Donate anonymously using crypto!

Ethereum

0xfe58350B80634f60Fa6Dc149a72b4DFbc17D341E copy

Bitcoin

3ATGMxNzCUFzxpMCHL5sWSt4DVtS8UqXpi copy

Thank you for your support!

Follow Us on Twitter!

:(