1/12 Texas C19 Update:
THREAD:
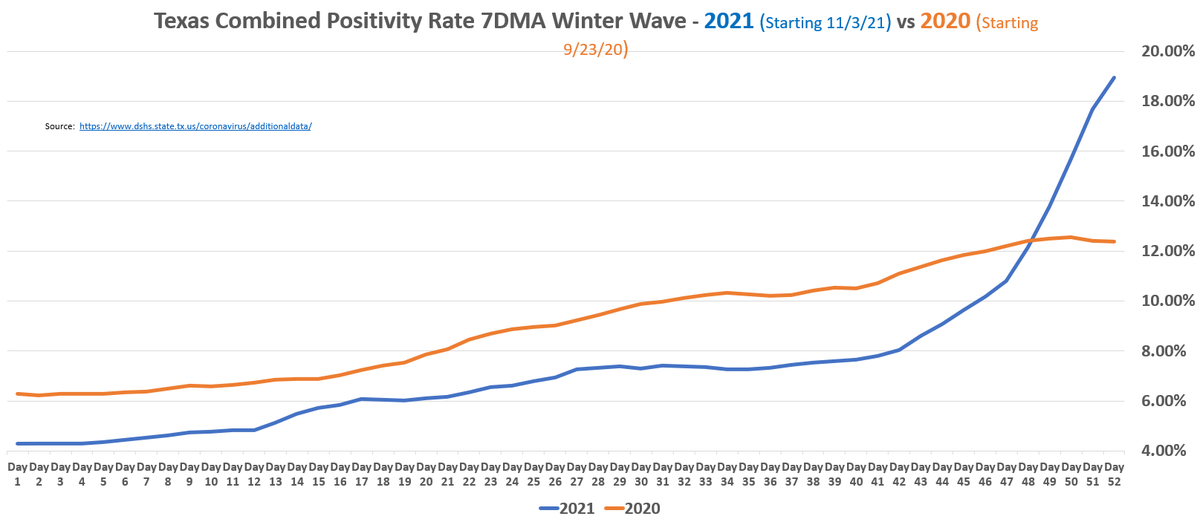
* It is possible positivity rate has already peaked
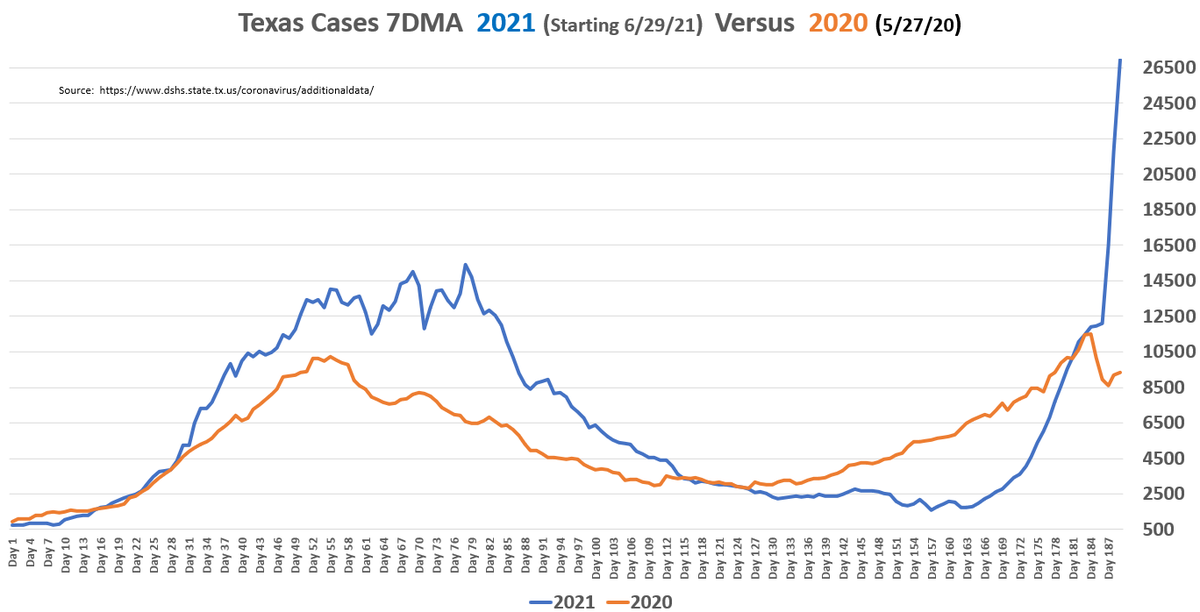
* new 1-day record for reported cases
* Various Hospital metrics rate of growth continues strong decline
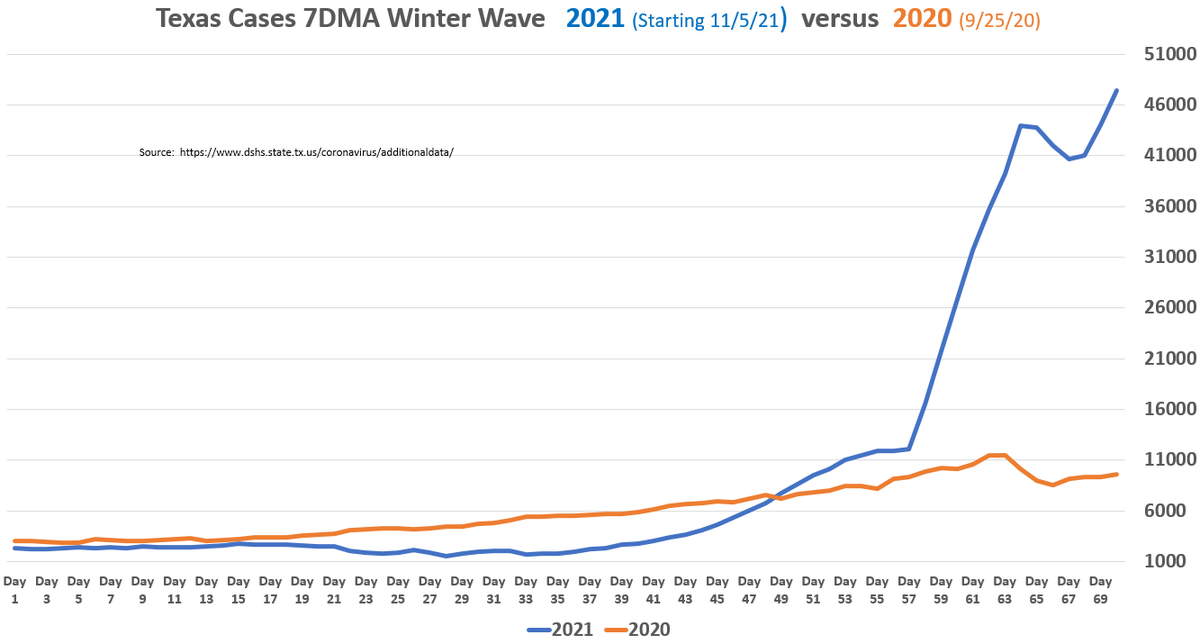
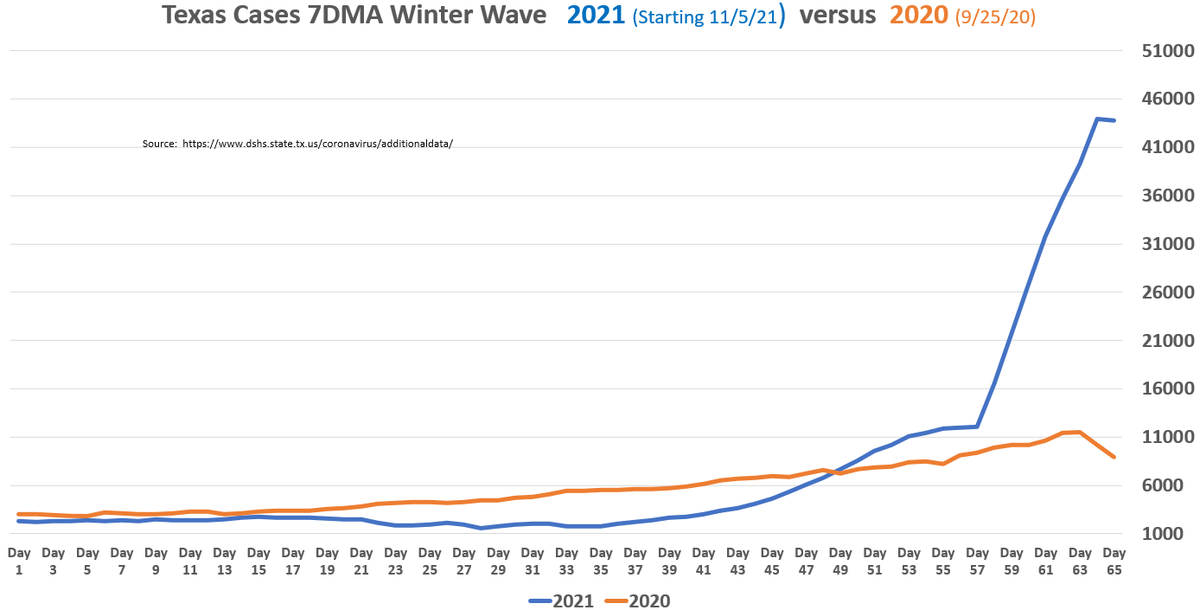
* Severe hospitalization still not at 2020 Winter pace yet, while cases are 5X 2020
1/n
THREAD:
* It is possible positivity rate has already peaked
* new 1-day record for reported cases
* Various Hospital metrics rate of growth continues strong decline
* Severe hospitalization still not at 2020 Winter pace yet, while cases are 5X 2020
1/n
https://twitter.com/therealarod1984/status/1481039028669628420
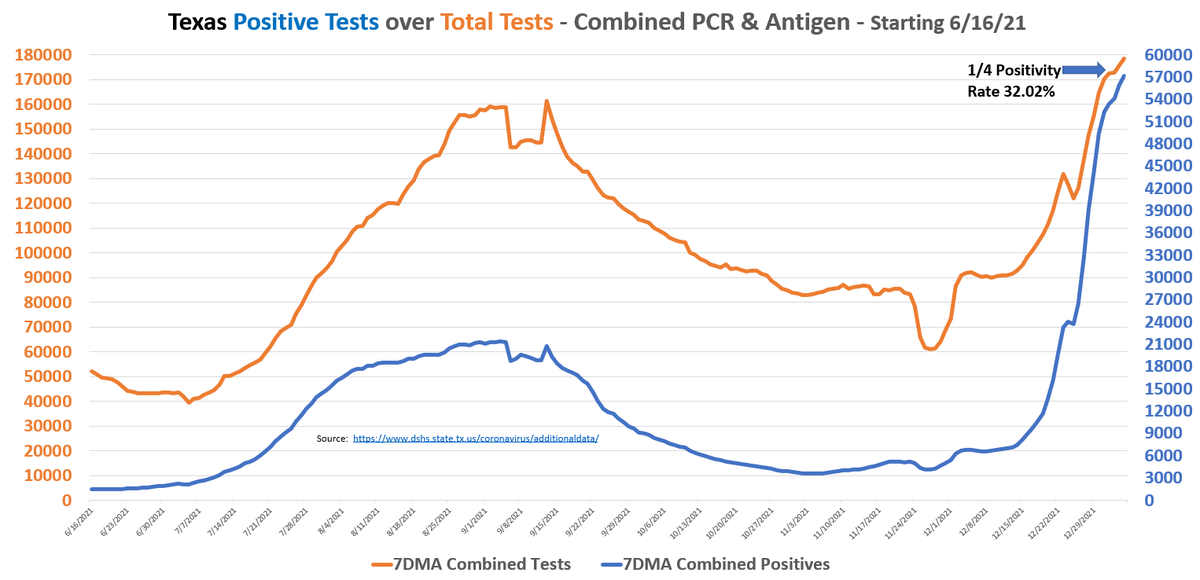
1/12 Testing
Tests filed by date of specimen collection < 8 days old is incomplete
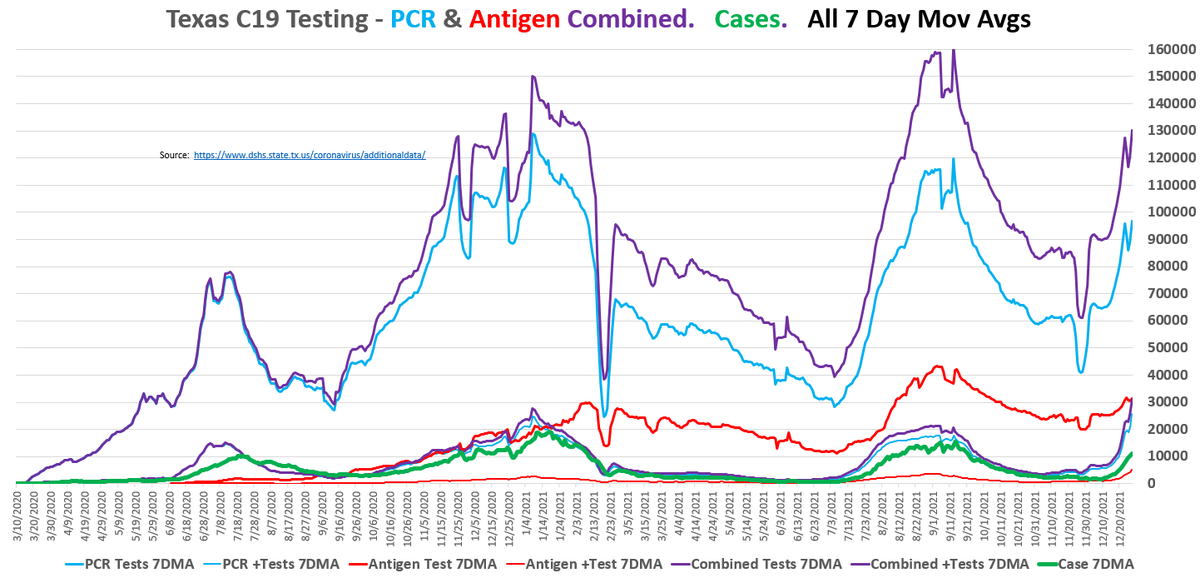
As of 1/2:
* Pos rate 31.52% but really flattening
* Positives @ 53K/day
* Testing @ 169K/day
* Its early but pos rate has formed a peak on 1/8. Could change, but 1st clear peak so far
2/n
.


Tests filed by date of specimen collection < 8 days old is incomplete
As of 1/2:
* Pos rate 31.52% but really flattening
* Positives @ 53K/day
* Testing @ 169K/day
* Its early but pos rate has formed a peak on 1/8. Could change, but 1st clear peak so far
2/n
.


1/12 - Cases
* Cases batched by date received by the county
* Case 7DMA~ 44K, after 60K+ day
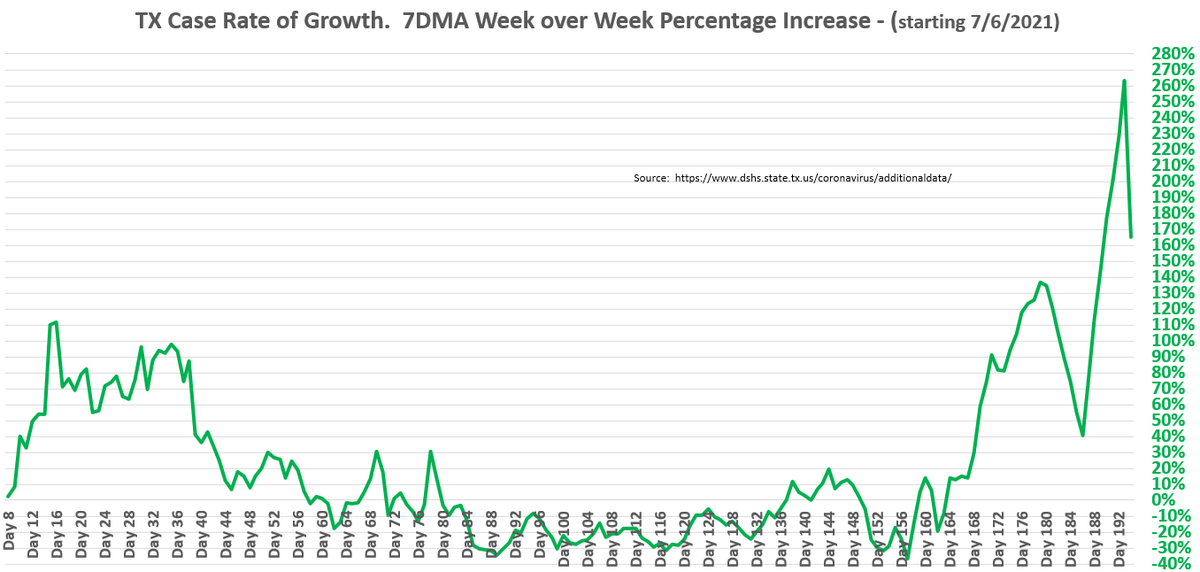
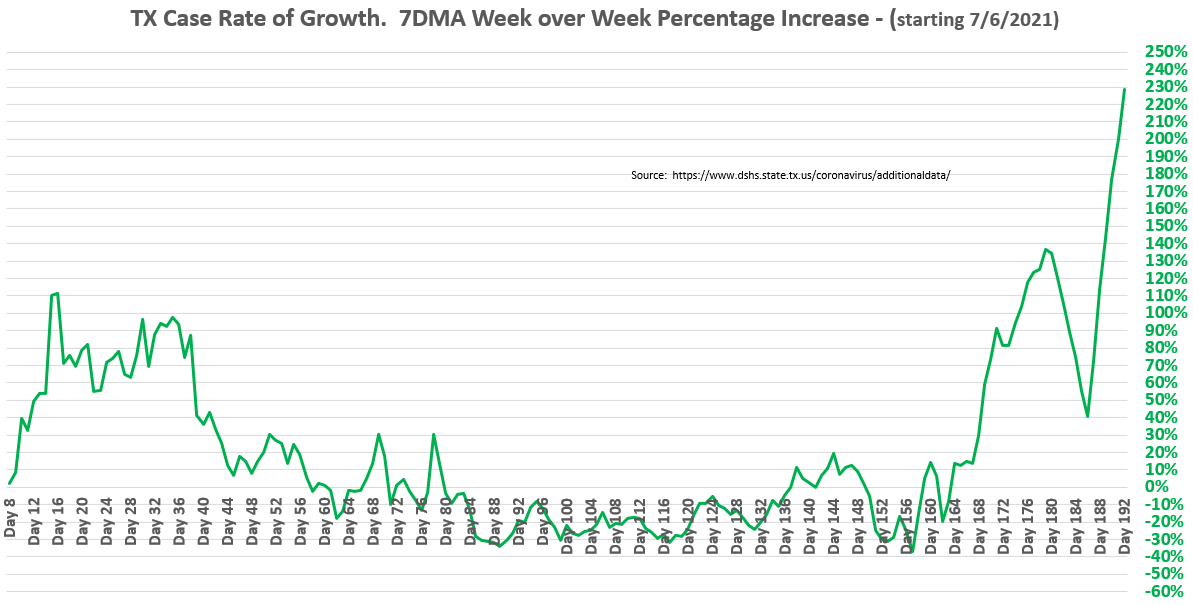
* Rate of growth⬇️
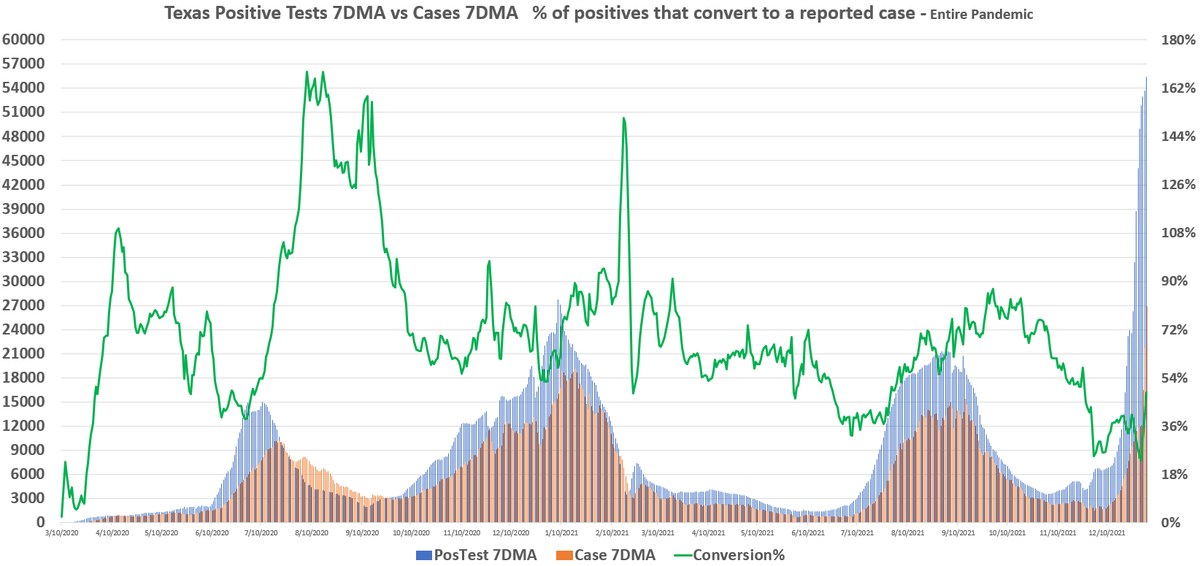
* The % of positive test conversion to cases is indicative of position in the wave. As of 1/2, that % is starting a steep climb. Helps confirm pos rate peak
,
3/n


* Cases batched by date received by the county
* Case 7DMA~ 44K, after 60K+ day
* Rate of growth⬇️
* The % of positive test conversion to cases is indicative of position in the wave. As of 1/2, that % is starting a steep climb. Helps confirm pos rate peak
,
3/n


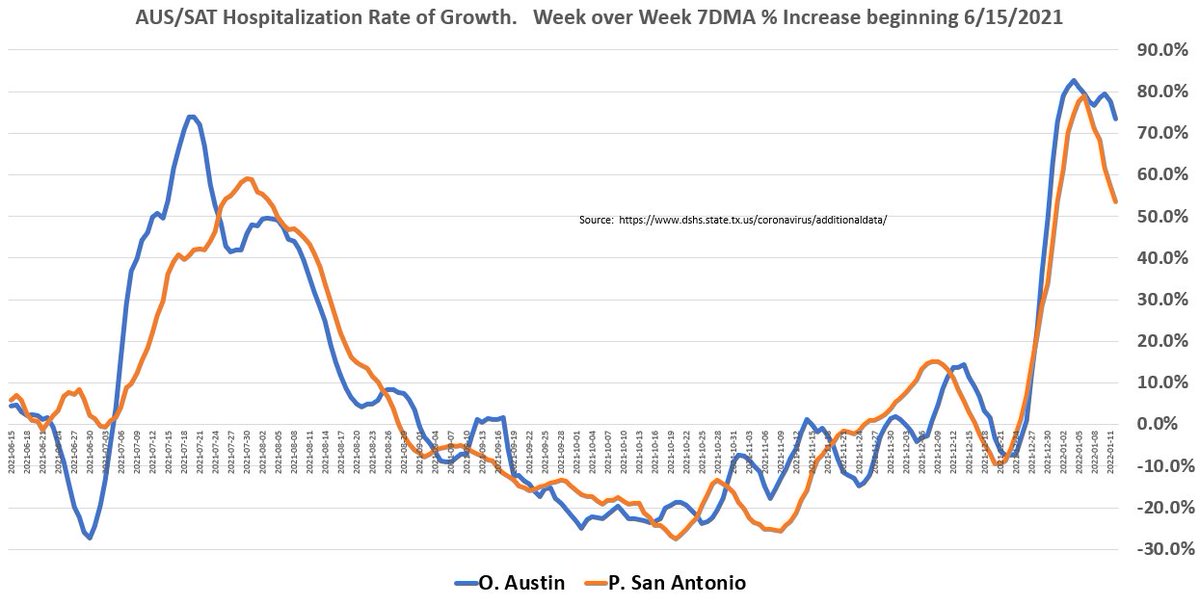
1/12 Hospitalizations - Part 1
* % of beds tagged as Covid & Census up to 18.75% & 11571
* Admits 7DMA - 1847. Past 2 Wednesdays had seen +300 admits day over day. Today only +158. 7DMA growth rate down to 33%
* Hosp growth rate is following suit
* HOU continues to cool
4/n


* % of beds tagged as Covid & Census up to 18.75% & 11571
* Admits 7DMA - 1847. Past 2 Wednesdays had seen +300 admits day over day. Today only +158. 7DMA growth rate down to 33%
* Hosp growth rate is following suit
* HOU continues to cool
4/n


1/12 Hospitalizations - Part 2
* Second chart on Houston, SETRAC Admits 7DMA has already nosed over and 7DMA rate of growth down to 11%
* ICU will catch 2020 pace tomorrow
* Vents likely still 5 days away.
* Remember cases are 500% above 2020 Winter pace. #notsevere
5/n
.


* Second chart on Houston, SETRAC Admits 7DMA has already nosed over and 7DMA rate of growth down to 11%
* ICU will catch 2020 pace tomorrow
* Vents likely still 5 days away.
* Remember cases are 500% above 2020 Winter pace. #notsevere
5/n
.


1/12 Conclusion
* Remember, cases are a function of testing
* If pos rate has peaked, its the 1st domino in fall of a wave. This wave is super steep, likely falls steeply too
* Summer '21, Hosps peaked ~21 days after pos rate. Cases 35 days, LOL. Going to be sooner here.
6/end
* Remember, cases are a function of testing
* If pos rate has peaked, its the 1st domino in fall of a wave. This wave is super steep, likely falls steeply too
* Summer '21, Hosps peaked ~21 days after pos rate. Cases 35 days, LOL. Going to be sooner here.
6/end
• • •
Missing some Tweet in this thread? You can try to
force a refresh


