1/6 Texas C19 Update: Still going
THREAD:
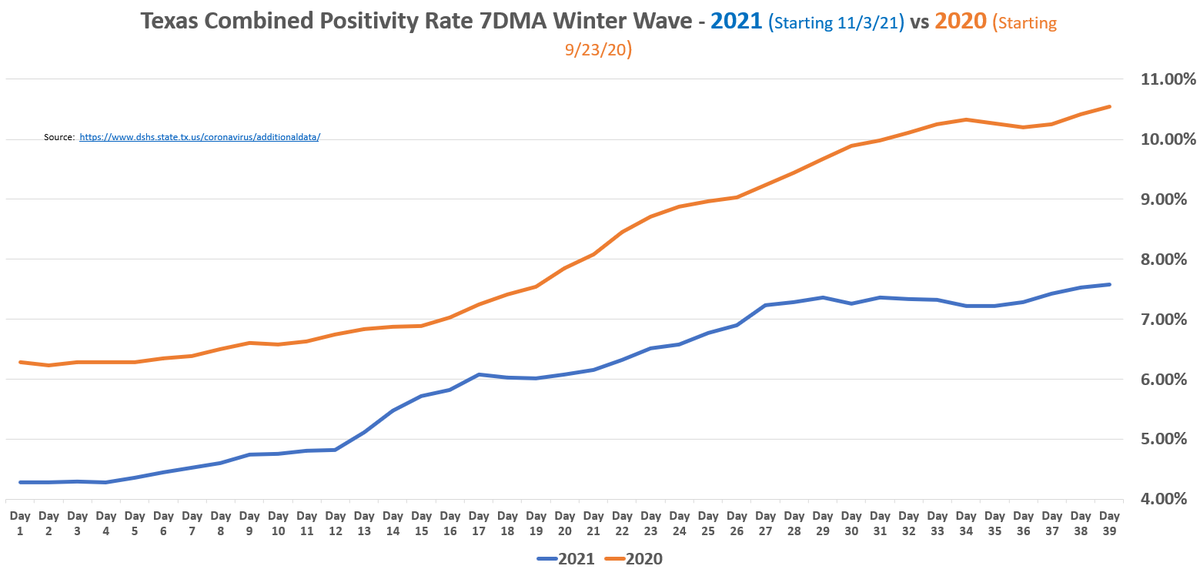
* Maybe seeing a peak form for combined positivity rate
* Day 6 of huge case numbers, a record 7DMA by 2X
* General Hospitalizations increasing but growth rate has crested
* ICU & Vents behind Winter 2020 Wave pace
1/n
THREAD:
* Maybe seeing a peak form for combined positivity rate
* Day 6 of huge case numbers, a record 7DMA by 2X
* General Hospitalizations increasing but growth rate has crested
* ICU & Vents behind Winter 2020 Wave pace
1/n
https://twitter.com/therealarod1984/status/1478881532991324160
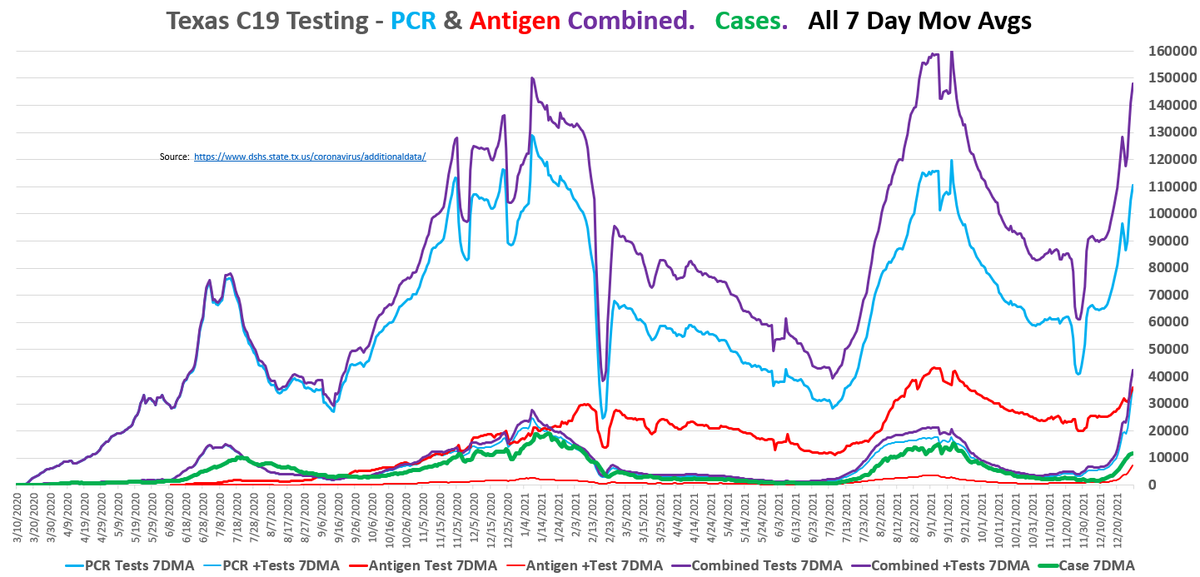
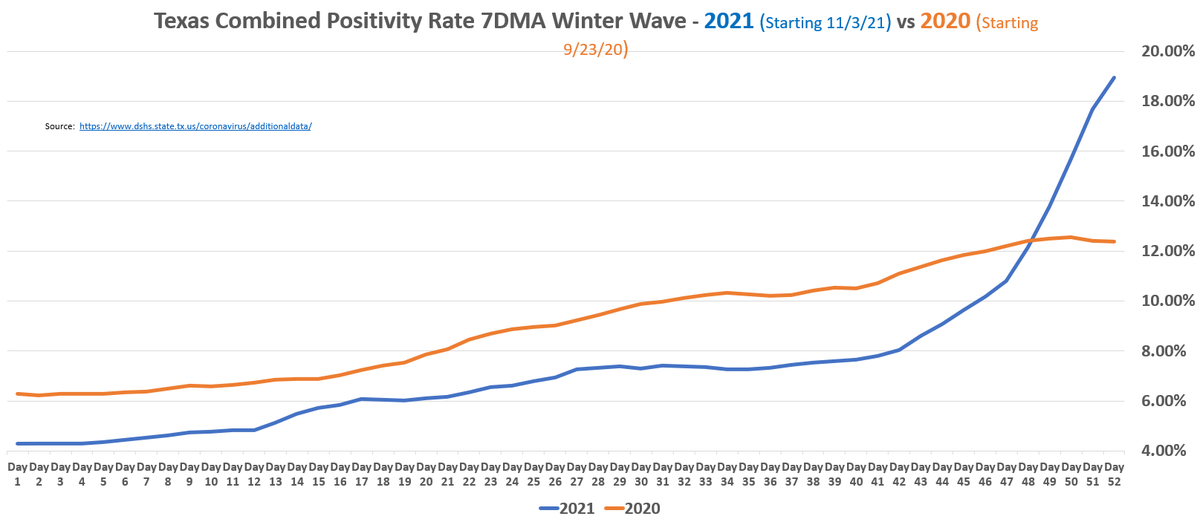
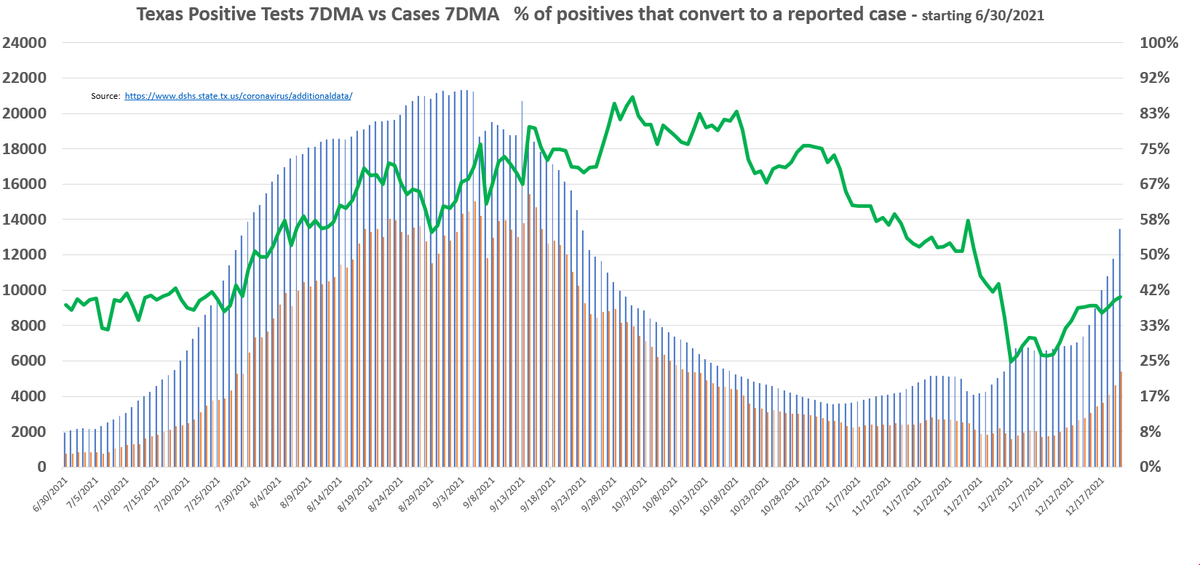
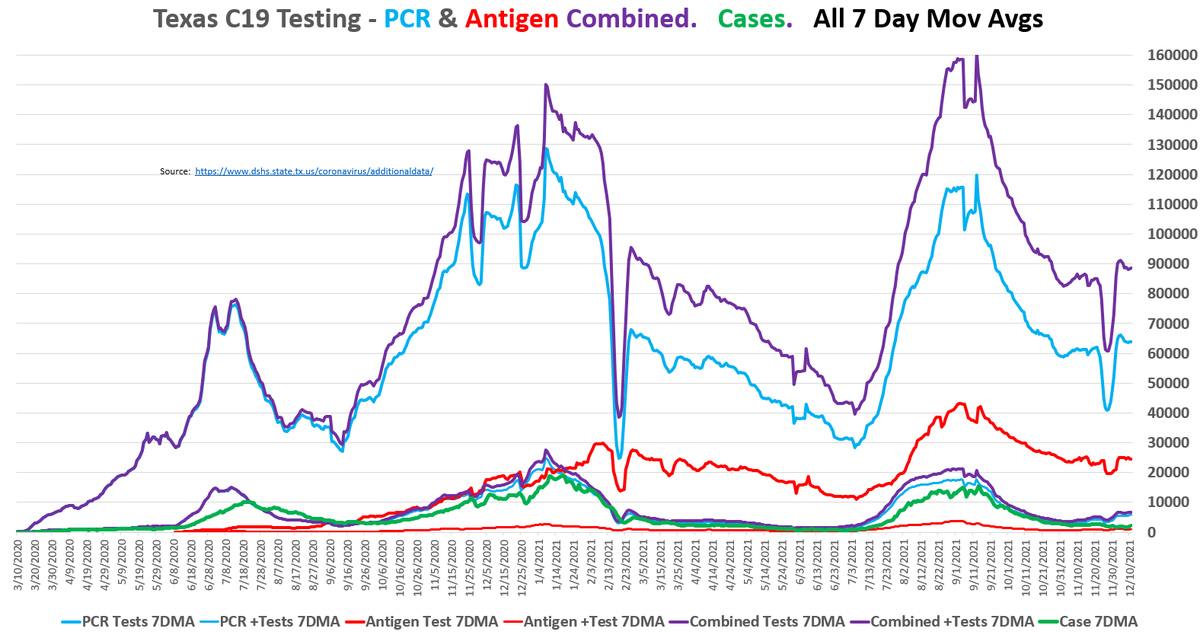
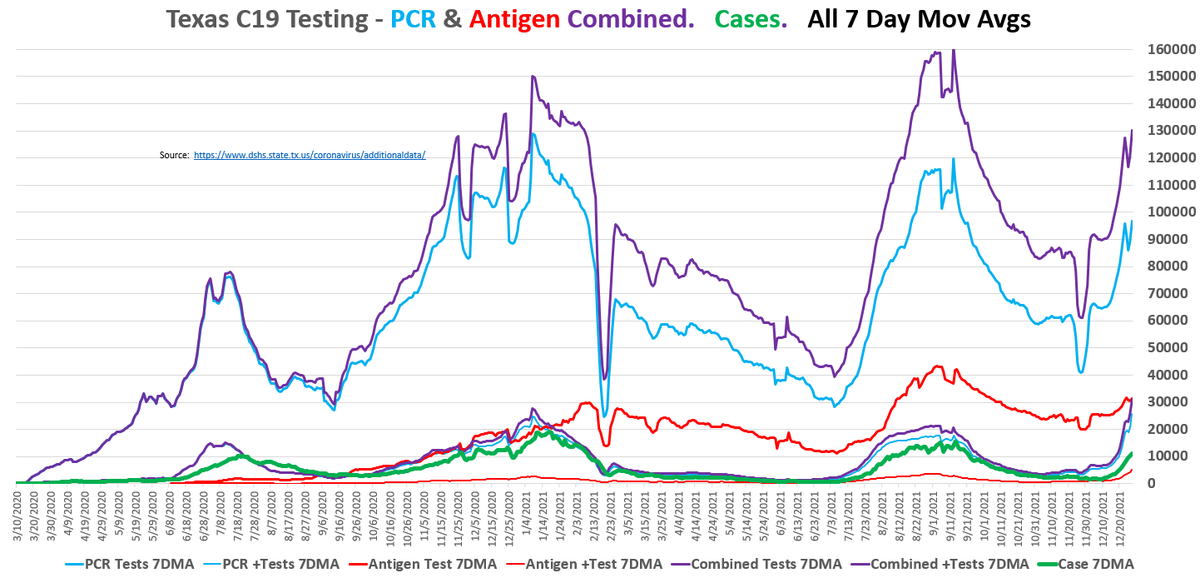
1/6 Testing
Tests filed by date of specimen collection, < 8 days old is incomplete
As of 12/27,
* Pos rate 23.91% on its way to ~31%
* Testing @ 130K/day on way to 155K
* Record positive tests
* Looking at more recent days, pos rate flattens @ 31%, will watch for a crest
2/n
.
Tests filed by date of specimen collection, < 8 days old is incomplete
As of 12/27,
* Pos rate 23.91% on its way to ~31%
* Testing @ 130K/day on way to 155K
* Record positive tests
* Looking at more recent days, pos rate flattens @ 31%, will watch for a crest
2/n
.


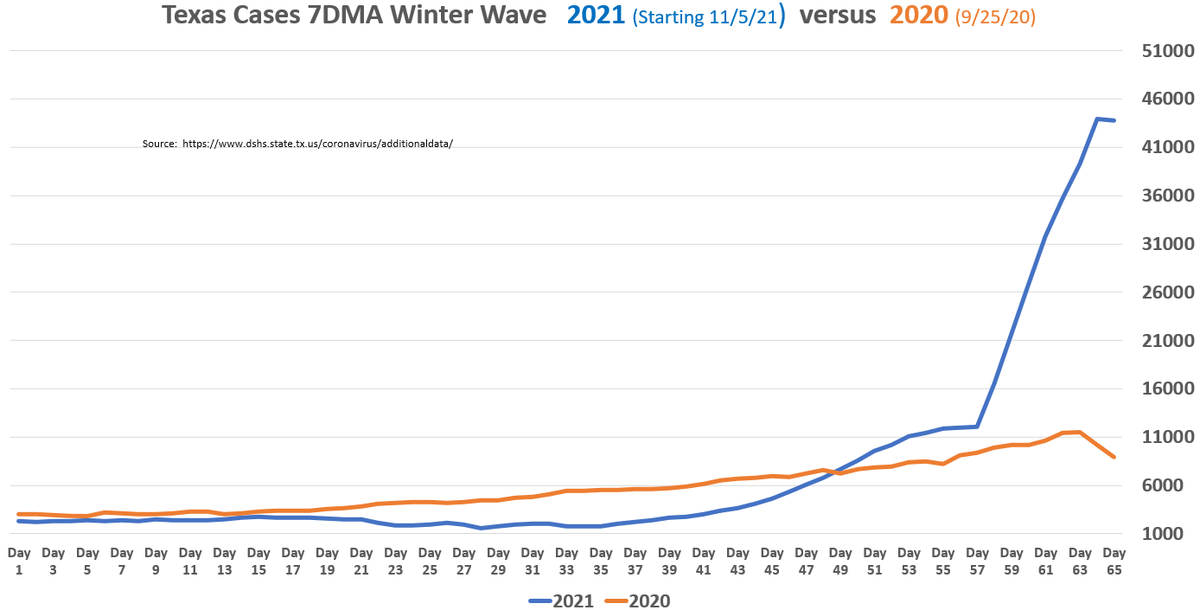
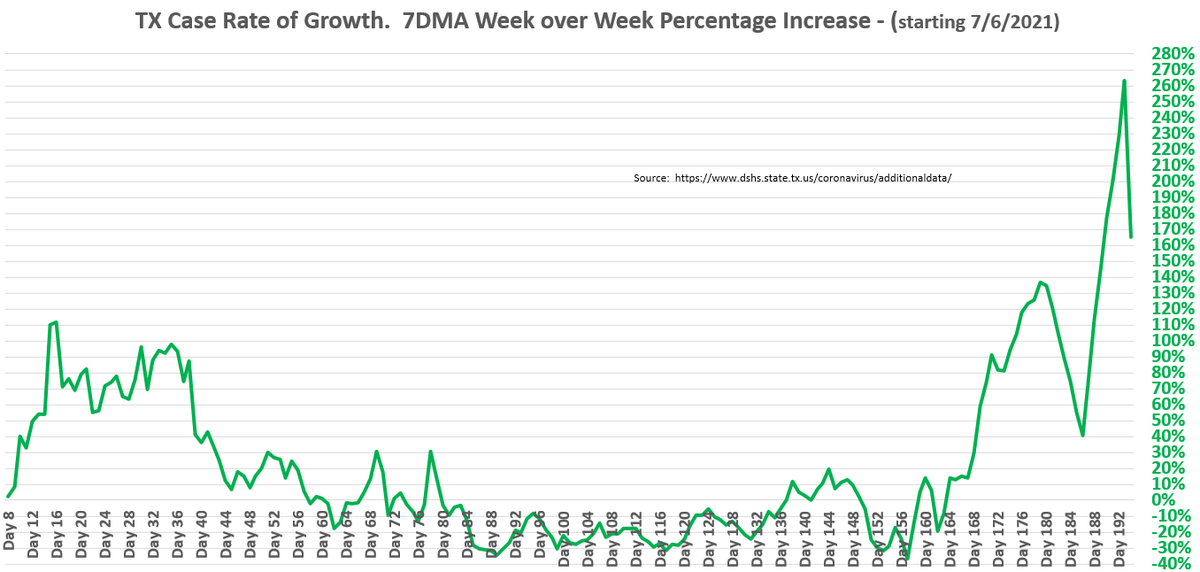
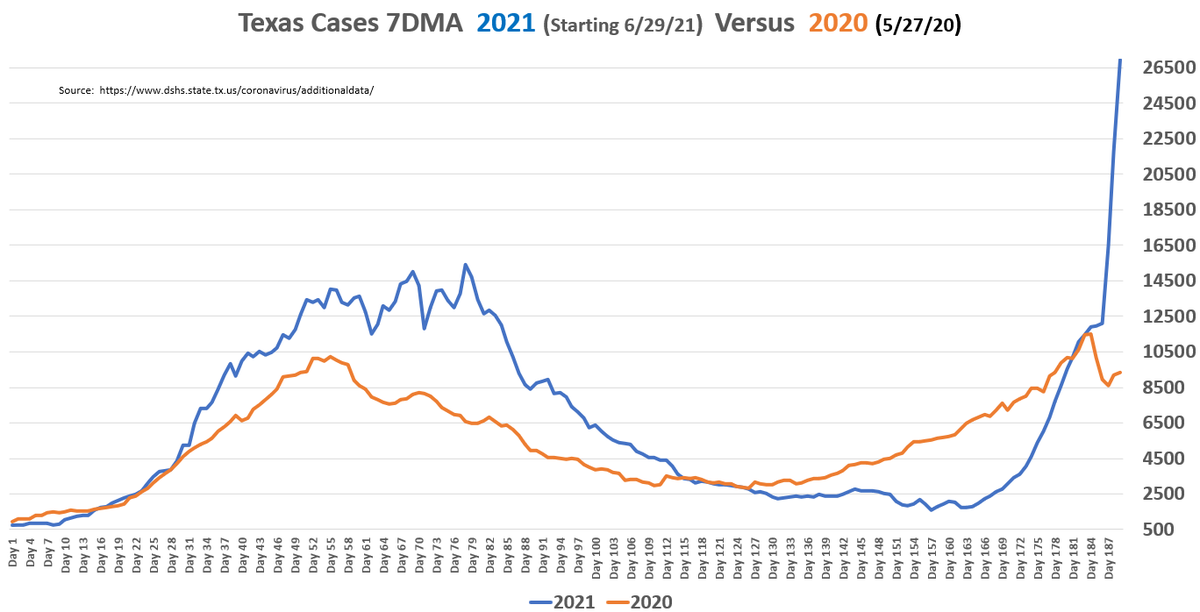
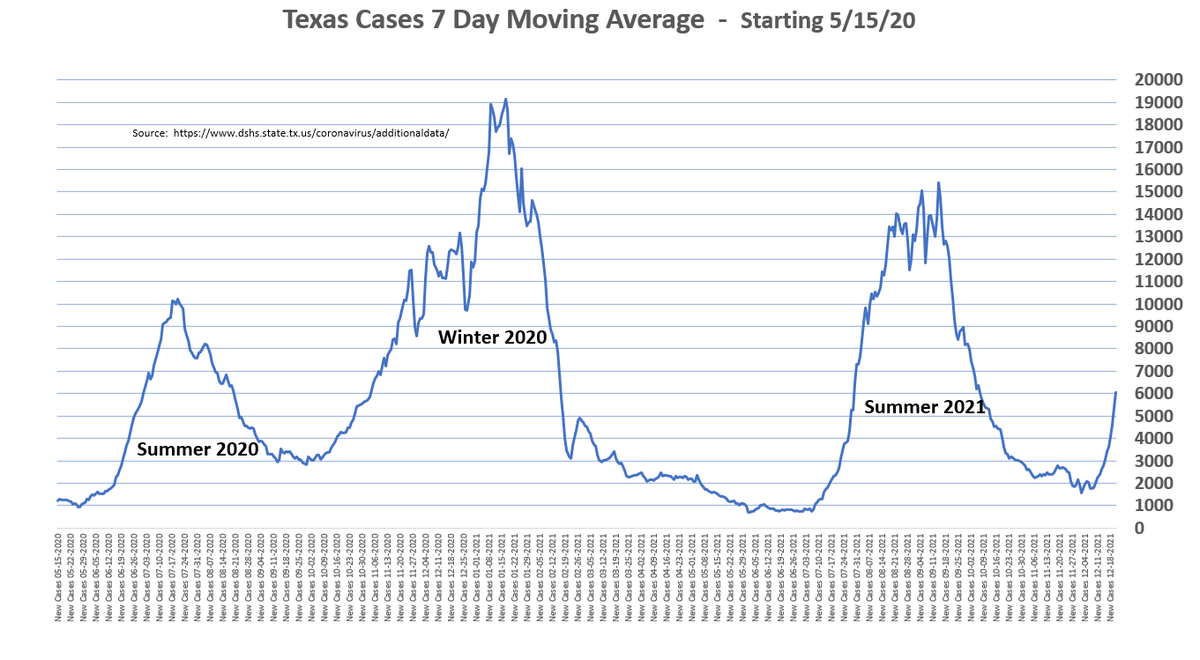
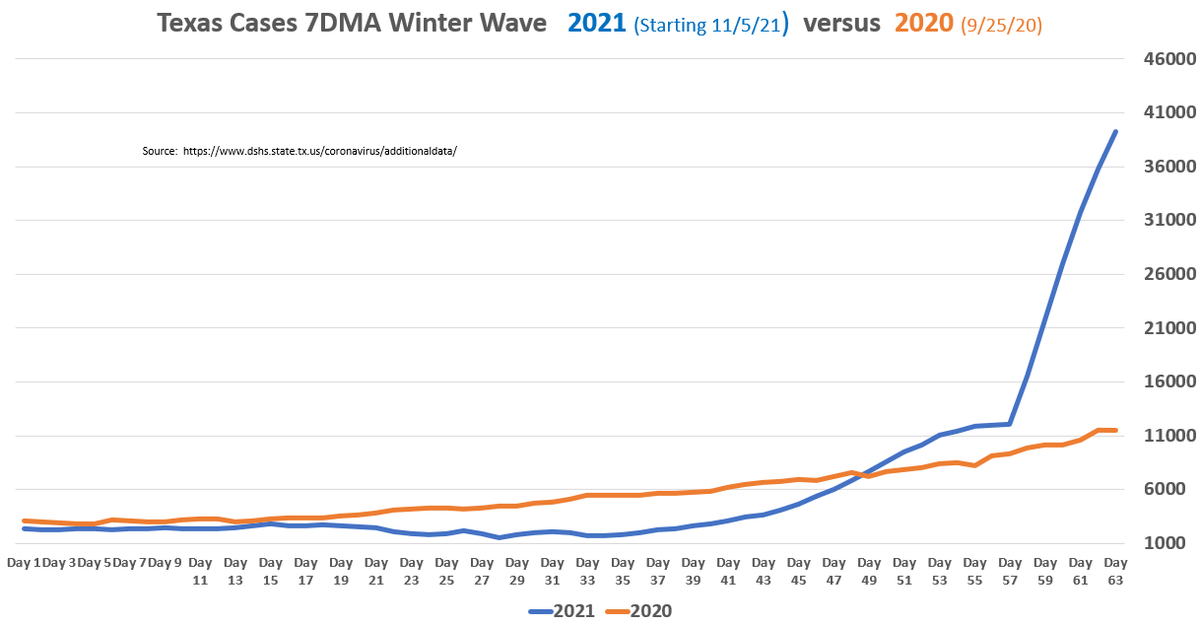
1/6 - Cases
* Cases batched by date received by the county
* Nearing 40K 7DMA, after 6th straight day of massive numbers
* More than twice the previous record set during Winter 2020
* After tomorrow, growth rate will plateau, but cases have gone wild
3/n
.
* Cases batched by date received by the county
* Nearing 40K 7DMA, after 6th straight day of massive numbers
* More than twice the previous record set during Winter 2020
* After tomorrow, growth rate will plateau, but cases have gone wild
3/n
.


1/6 Hospitalizations - Part 1
* % of beds tagged as Covid 14.33%, census at 8740
* Admits 7DMA rising to 1380, but growth rate decreases for 4th straight day
* Gen hospitalizations growth rate appears to have plateaued also. Now we watch for the steepness of the decline
4/n
.
* % of beds tagged as Covid 14.33%, census at 8740
* Admits 7DMA rising to 1380, but growth rate decreases for 4th straight day
* Gen hospitalizations growth rate appears to have plateaued also. Now we watch for the steepness of the decline
4/n
.


1/6 Hospitalizations - Part 2
* ICU still many days away from catching 2020 Winter wave
* ICU portion of the bed census 1711
* Vent usage has a really long ways to go to catch 2020 & isnt making up much ground
* The ratio of cases to severe hospitalization still crazy low
5/n
.
* ICU still many days away from catching 2020 Winter wave
* ICU portion of the bed census 1711
* Vent usage has a really long ways to go to catch 2020 & isnt making up much ground
* The ratio of cases to severe hospitalization still crazy low
5/n
.


1/6 Conclusion
* Positive Tests/Cases have one more day of crazy rise and then should plateau. There might still be some growth there, but that's TBD
* Positivity Rate may be forming a peak, well see.
* Its a massive #casedemic right now, but that could still change?
6/end
* Positive Tests/Cases have one more day of crazy rise and then should plateau. There might still be some growth there, but that's TBD
* Positivity Rate may be forming a peak, well see.
* Its a massive #casedemic right now, but that could still change?
6/end
• • •
Missing some Tweet in this thread? You can try to
force a refresh