1/3 Texas C19 Update: Everyone is getting it
THREAD:
* Shocking number of cases reported the past 3 days, shattering Covid case records
* Severe cases rising but nothing like cases
* Should be a steep but short wave
* Vaccine mandates LOL. Yeah OK.
1/n
THREAD:
* Shocking number of cases reported the past 3 days, shattering Covid case records
* Severe cases rising but nothing like cases
* Should be a steep but short wave
* Vaccine mandates LOL. Yeah OK.
1/n
https://twitter.com/therealarod1984/status/1476620218478862338
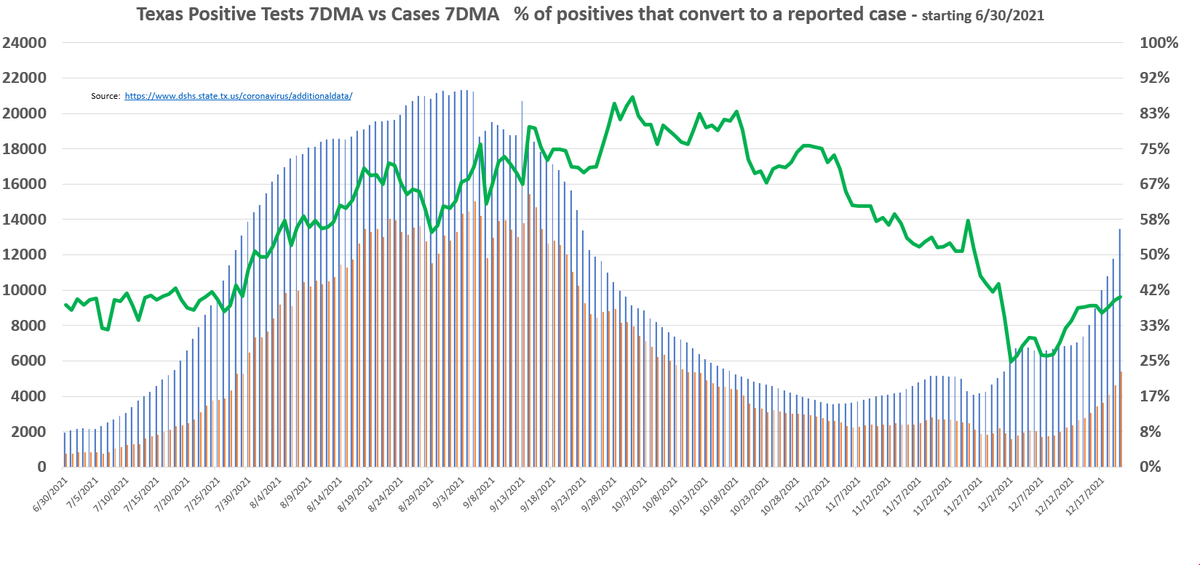
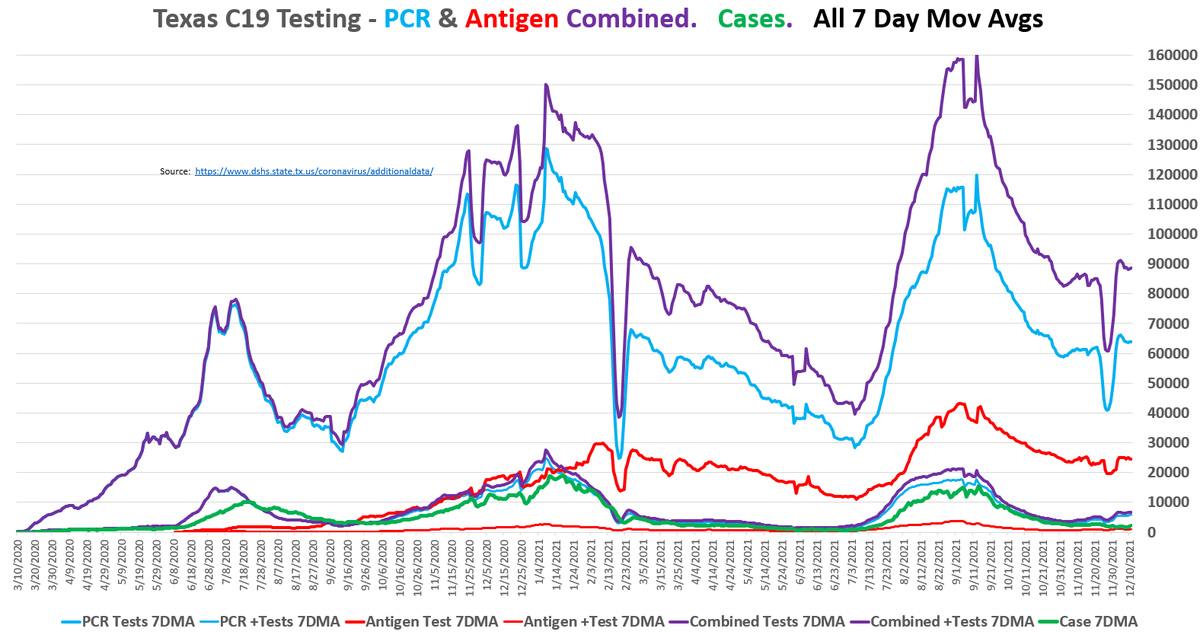
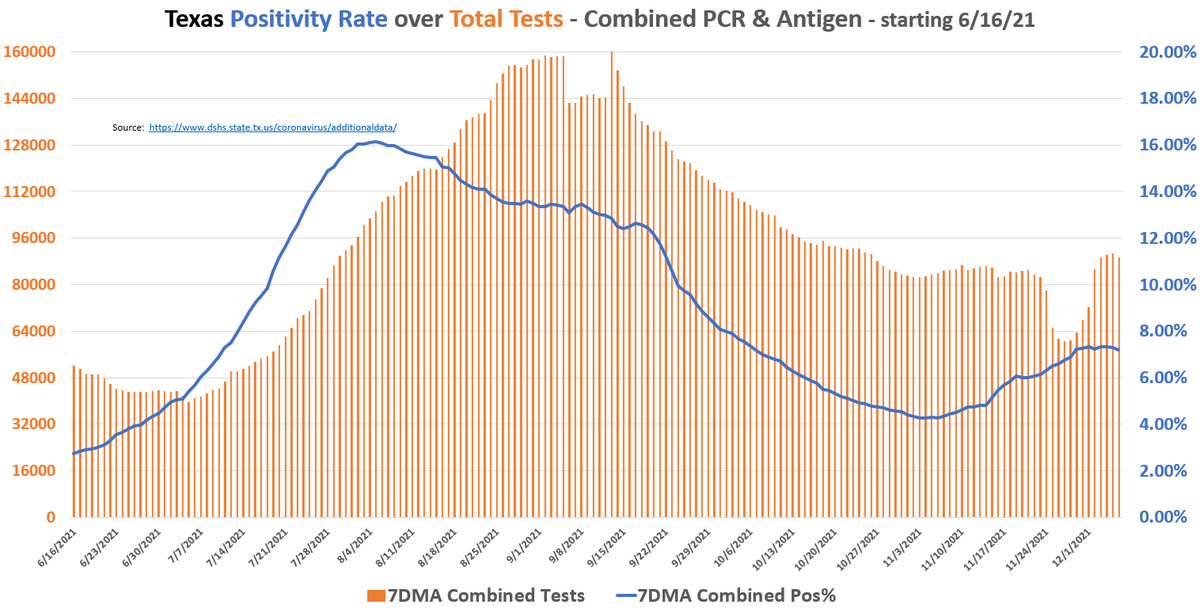
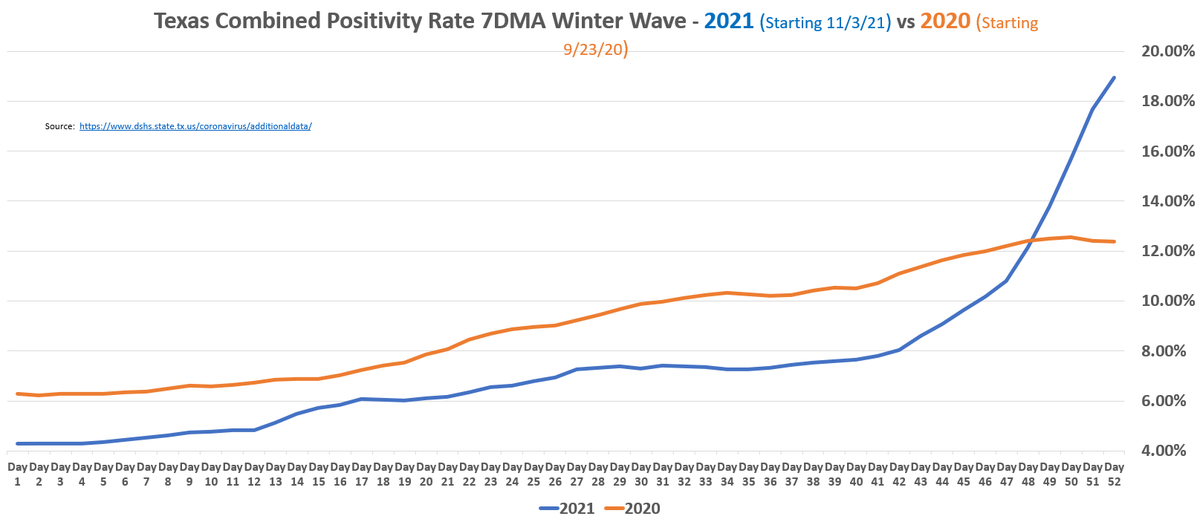
1/3 Testing
Tests filed by date of specimen collection, < 8 days old is incomplete
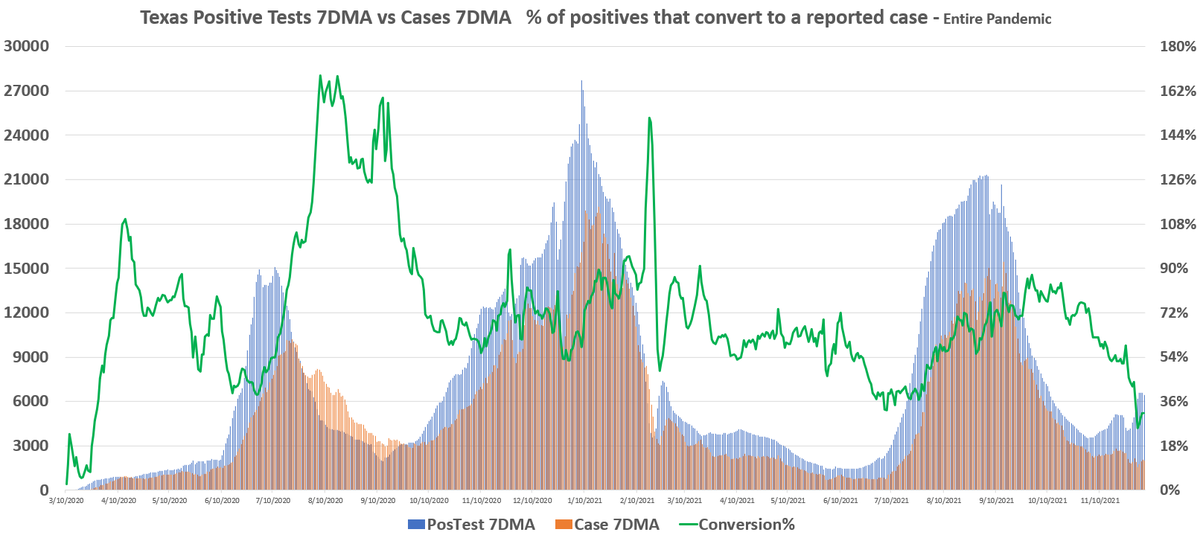
As of 12/24, in a steep wave:
* Pos rate @ 18.94%, more growth to come
* Testing ~ 125K day
* Conversion of positives indicates still early in wave on 12/24, but that may change soon...
2/n
.
Tests filed by date of specimen collection, < 8 days old is incomplete
As of 12/24, in a steep wave:
* Pos rate @ 18.94%, more growth to come
* Testing ~ 125K day
* Conversion of positives indicates still early in wave on 12/24, but that may change soon...
2/n
.


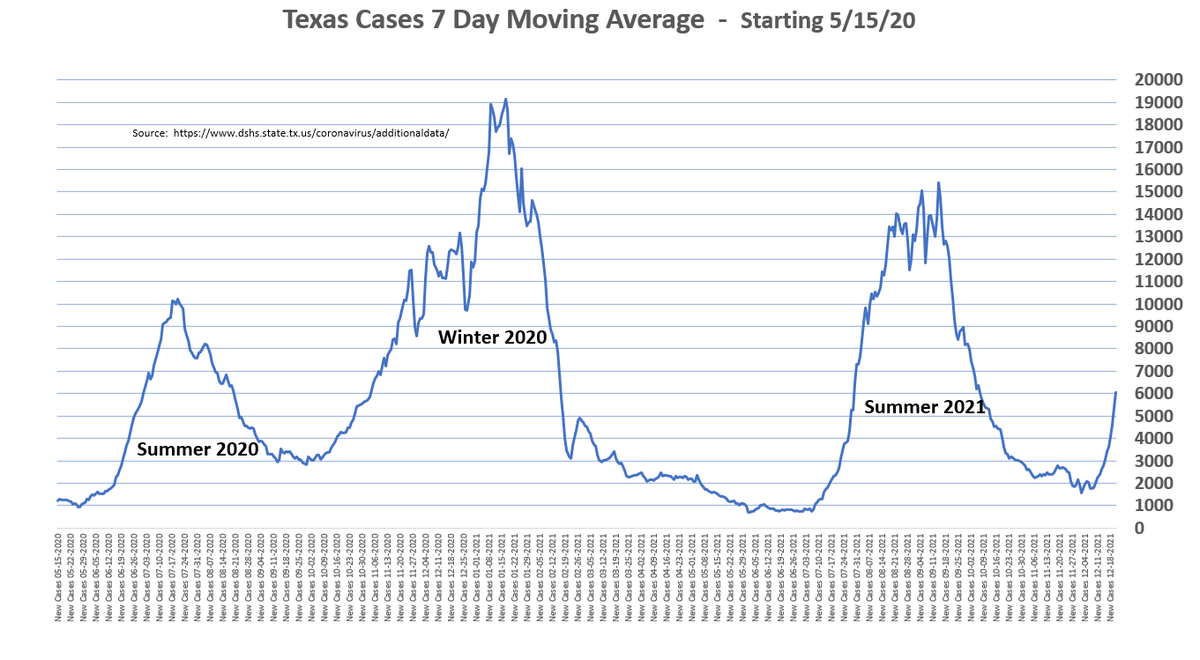
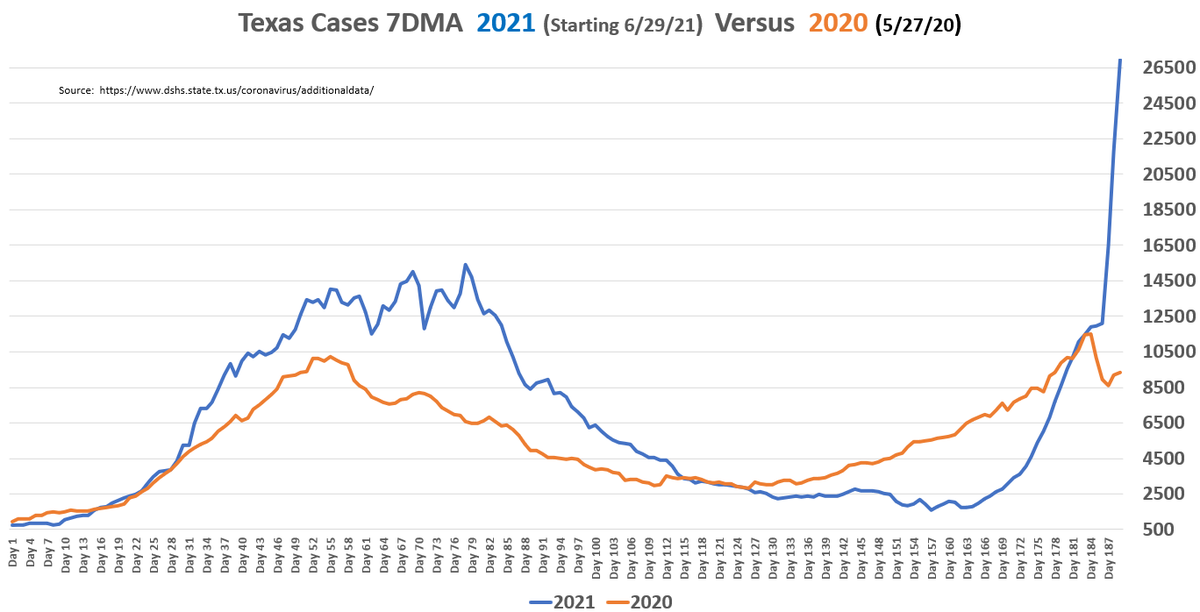
1/3 - Cases
* Cases are batched by date received by the county
* Records numbers of cases reported, starting to catch up from all the unreported positive tests
* Brand new records for daily reported and 7DMA. With 72% of the eligible pop and 77% of adults vaxxed
3/n
.
* Cases are batched by date received by the county
* Records numbers of cases reported, starting to catch up from all the unreported positive tests
* Brand new records for daily reported and 7DMA. With 72% of the eligible pop and 77% of adults vaxxed
3/n
.


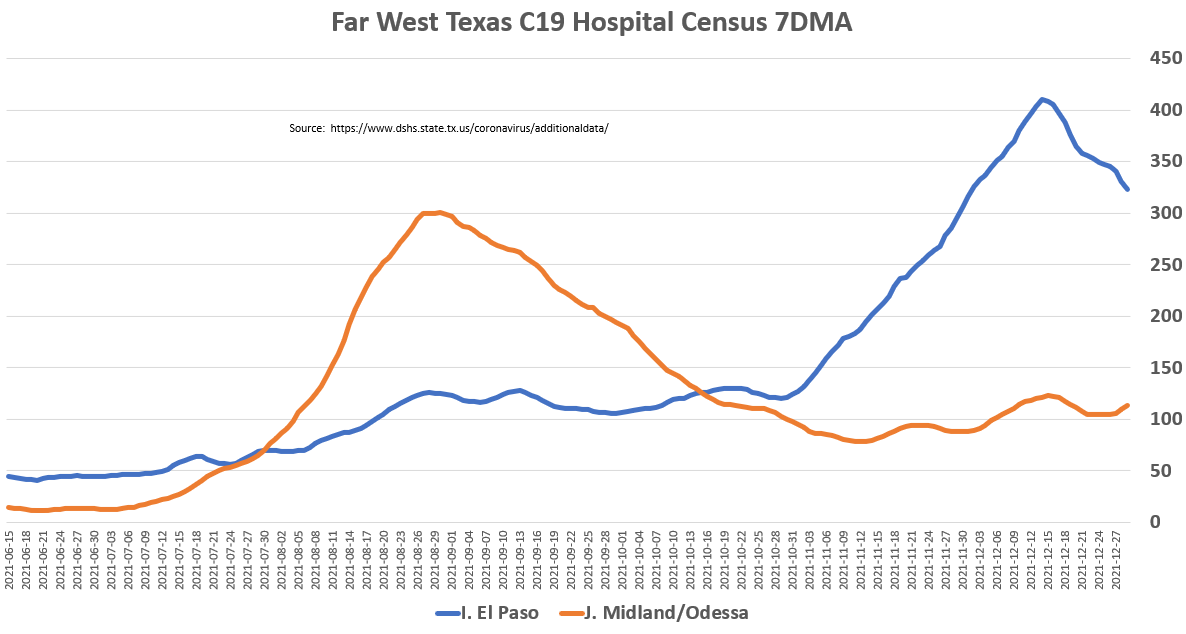
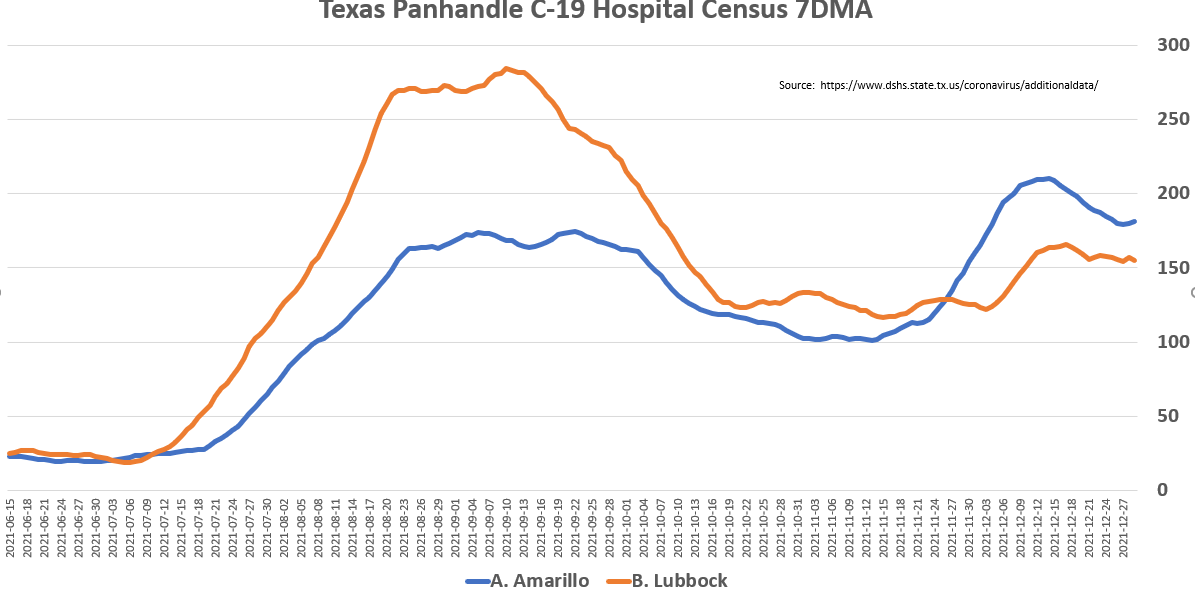
1/3 Hospitalizations - Part 1
* % of beds tagged as Covid 11.89%, census at 7015.
* Admits 7DMA rising sharply to 1236, indicating increased census coming. But growth rate increase has topped out
* Still 99% an East/South part of Texas, Texas Triangle wave
4/n
.
* % of beds tagged as Covid 11.89%, census at 7015.
* Admits 7DMA rising sharply to 1236, indicating increased census coming. But growth rate increase has topped out
* Still 99% an East/South part of Texas, Texas Triangle wave
4/n
.


1/3 Hospitalizations - Part 2
* Severe cases in a much more shallow rise & still a ways to go to catch 2020 Winter wave
* ICU portion of the bed census 1454
* New chart for Vent usage 2021 vs 2020
* The ratio of cases to severe hospitalization/vent at an all-time low
5/n
.
* Severe cases in a much more shallow rise & still a ways to go to catch 2020 Winter wave
* ICU portion of the bed census 1454
* New chart for Vent usage 2021 vs 2020
* The ratio of cases to severe hospitalization/vent at an all-time low
5/n
.


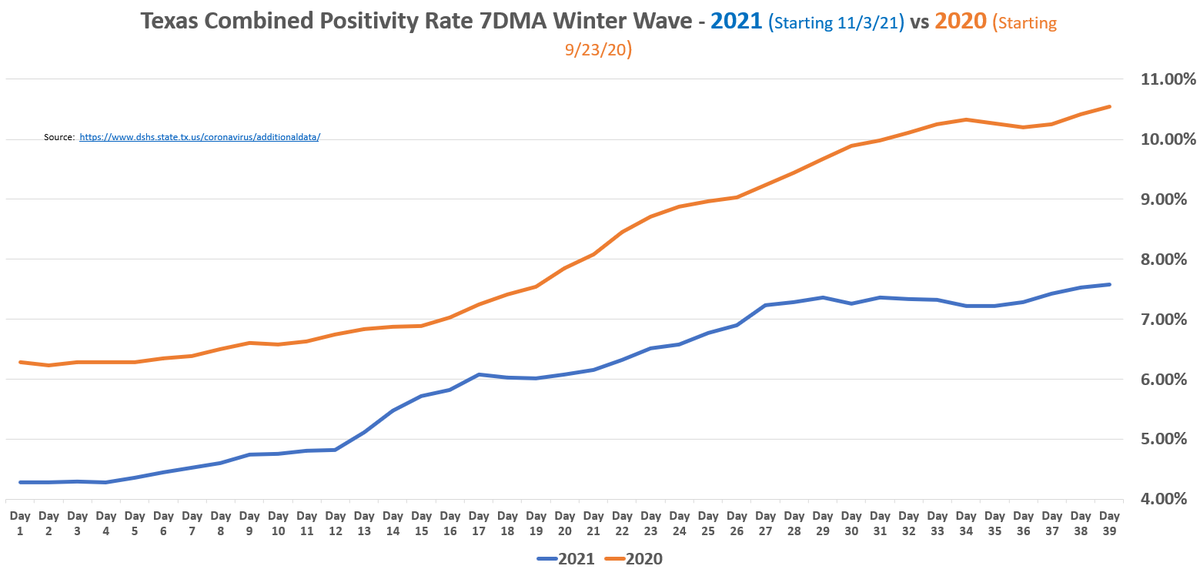
1/3 Conclusion
* Positive Tests/Cases have blown the doors off of any previous comparison during this pandemic
* General hospitalizations nearing 2020 Winter pace
* ICU/Vent a long ways off vs 2020
* May start looking at fatalities & CFR, which has to be at a record low
6/end
* Positive Tests/Cases have blown the doors off of any previous comparison during this pandemic
* General hospitalizations nearing 2020 Winter pace
* ICU/Vent a long ways off vs 2020
* May start looking at fatalities & CFR, which has to be at a record low
6/end
• • •
Missing some Tweet in this thread? You can try to
force a refresh