1/8 Texas C19 Update: Mid-Rise?
THREAD:
* Indications are that we are mid-way+ through the rise of this wave
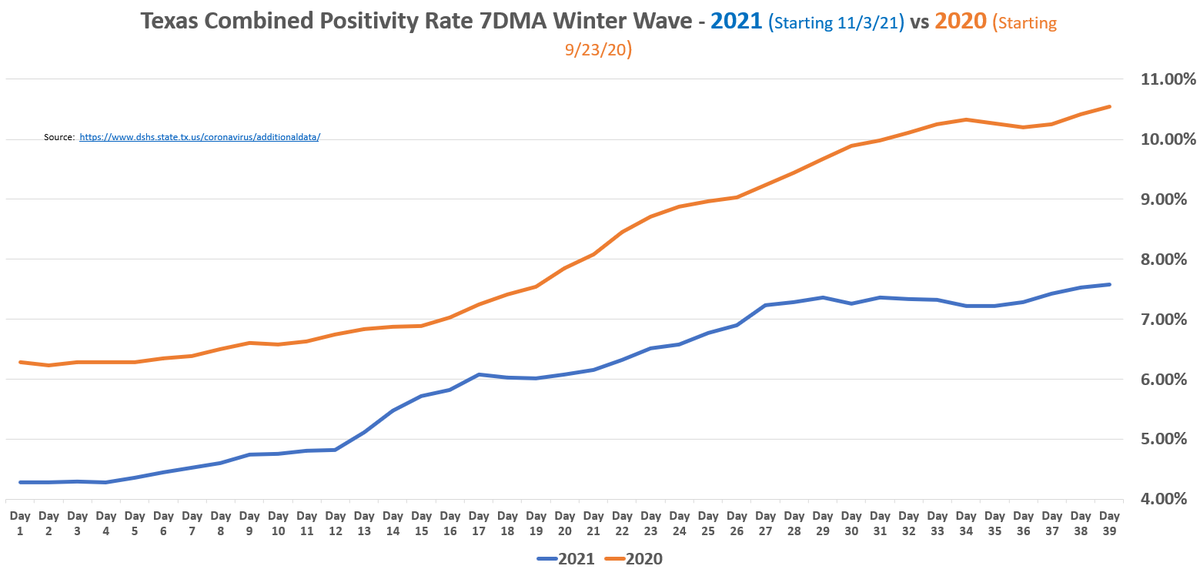
* Positivity Rate growth is decreasing
* Crazy high Cases have topped out
* Hospital Admits are really starting a taper
* ICU and Vents still not keeping pace
1/n
THREAD:
* Indications are that we are mid-way+ through the rise of this wave
* Positivity Rate growth is decreasing
* Crazy high Cases have topped out
* Hospital Admits are really starting a taper
* ICU and Vents still not keeping pace
1/n
https://twitter.com/therealarod1984/status/1479225961518596096
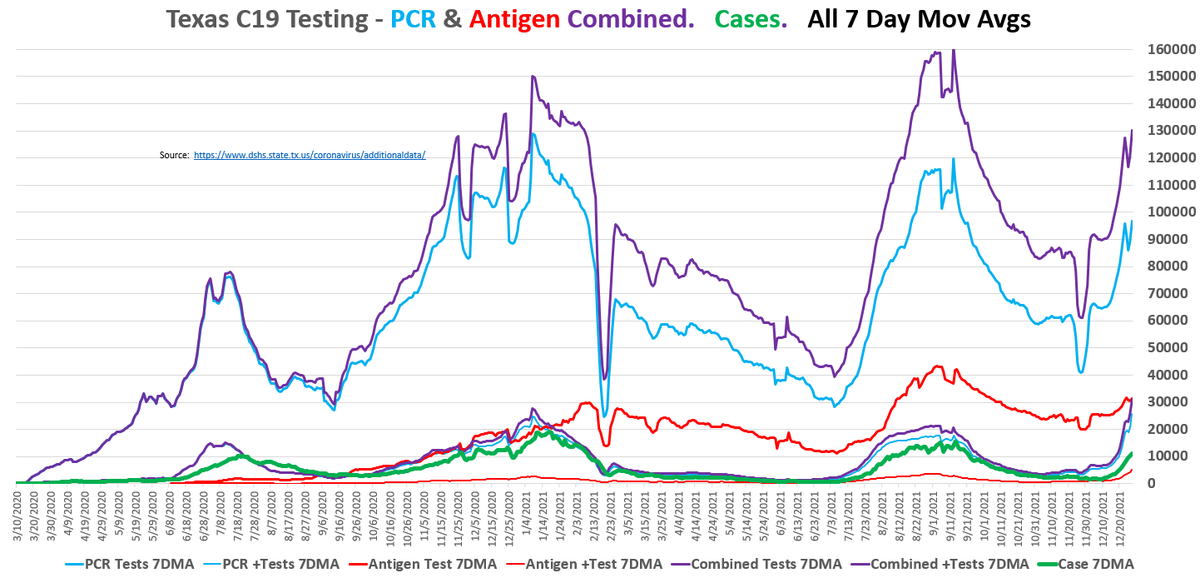
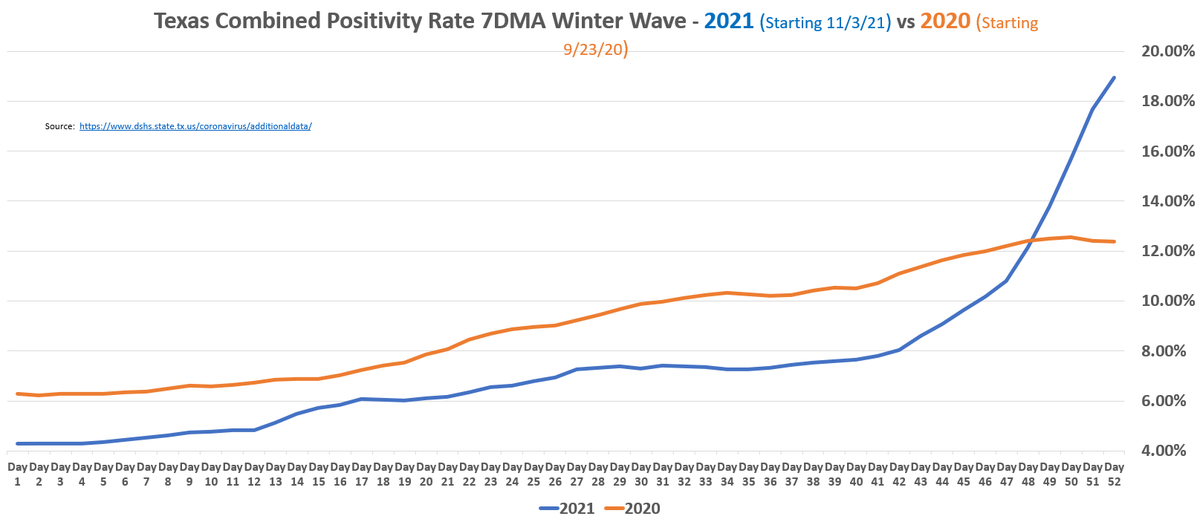
1/8 Testing
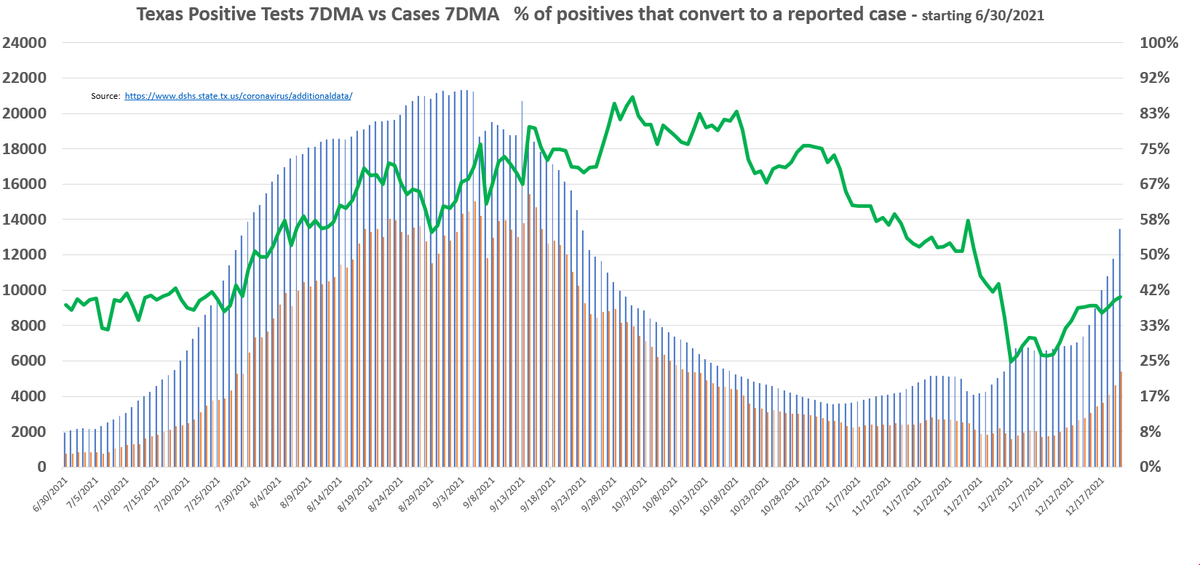
Tests filed by date of specimen collection, < 8 days old is incomplete
As of 12/29,
* Pos rate 28.75% on its way to ~31%
* Positives at 42K/day on way to 50K. #Crazy
* Testing @ 148K/day on way to 160K
* Pos% rate will crest in the low 30s in coming days
2/n
.


Tests filed by date of specimen collection, < 8 days old is incomplete
As of 12/29,
* Pos rate 28.75% on its way to ~31%
* Positives at 42K/day on way to 50K. #Crazy
* Testing @ 148K/day on way to 160K
* Pos% rate will crest in the low 30s in coming days
2/n
.


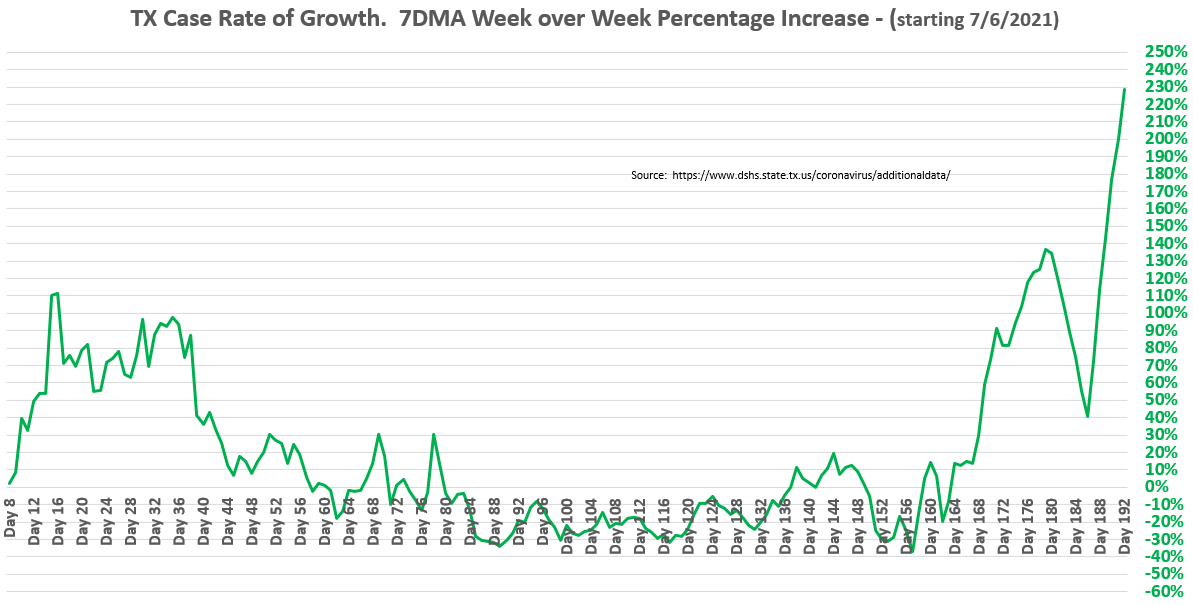
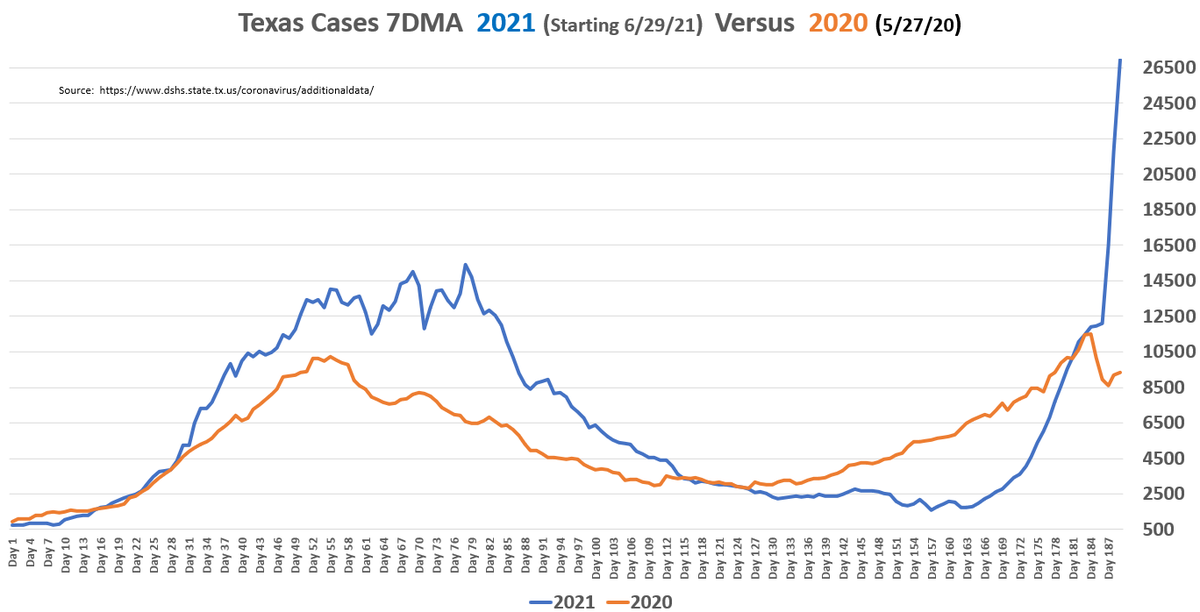
1/8 - Cases
* Cases batched by date received by the county
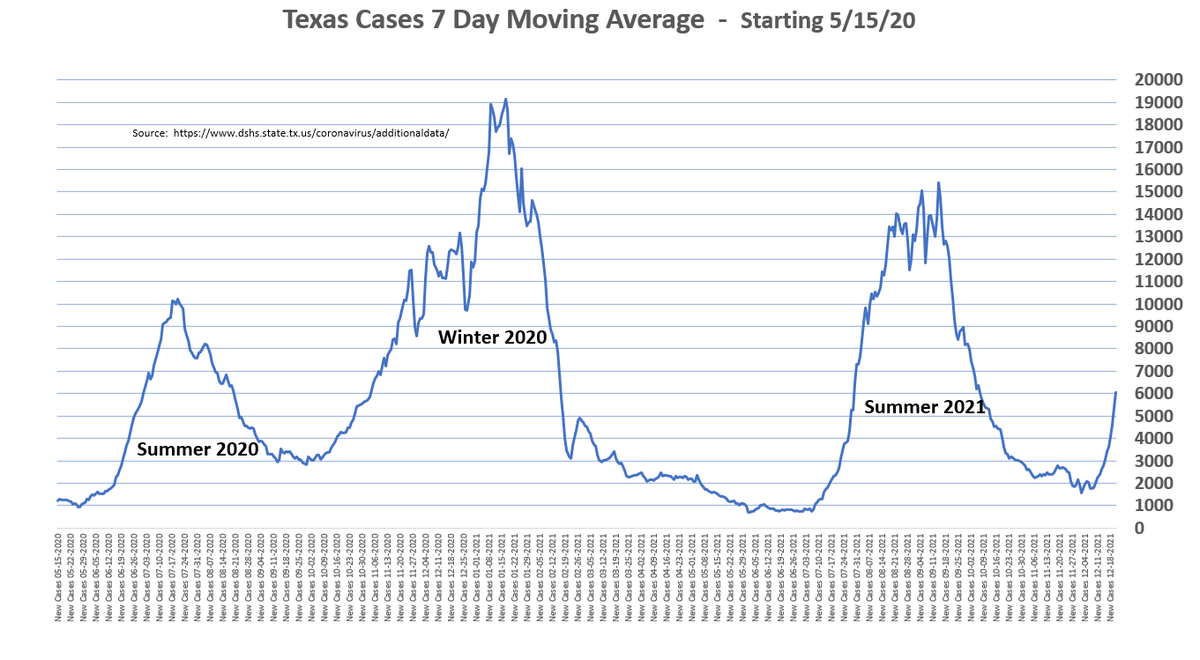
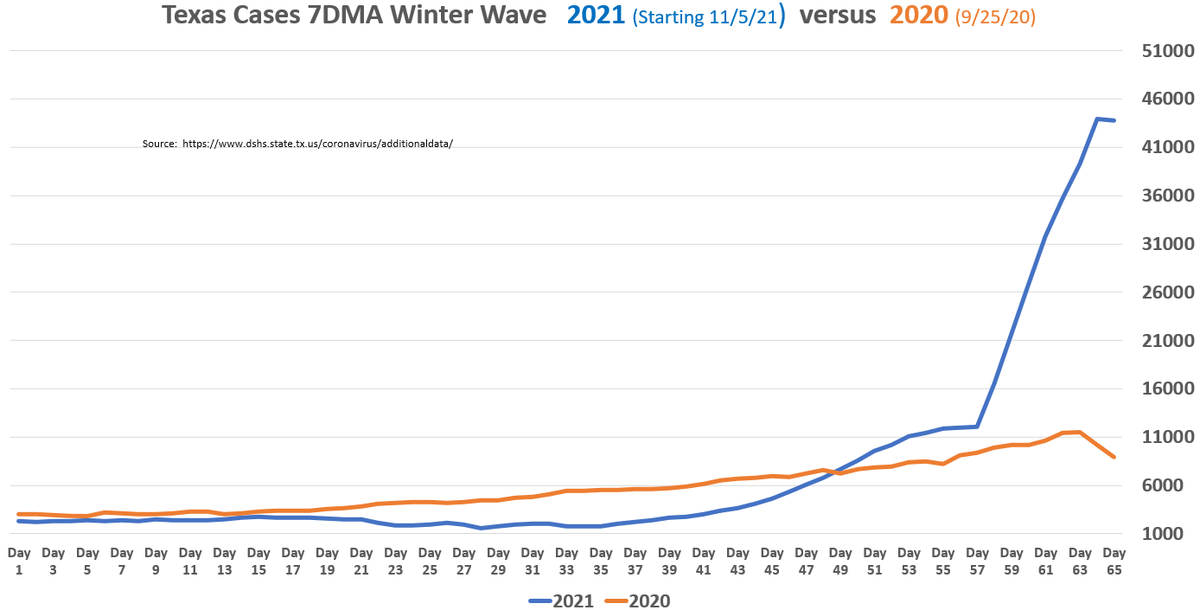
* Topping out at 43K 7DMA & finally a decline, after 8 days of huge numbers
* 225% higher than previous C19 record & 500% higher than this point in 2020 Winter wave
* Will likely sit @ 40K range for a few days
3/n
.


* Cases batched by date received by the county
* Topping out at 43K 7DMA & finally a decline, after 8 days of huge numbers
* 225% higher than previous C19 record & 500% higher than this point in 2020 Winter wave
* Will likely sit @ 40K range for a few days
3/n
.


1/6 Hospitalizations - Part 1
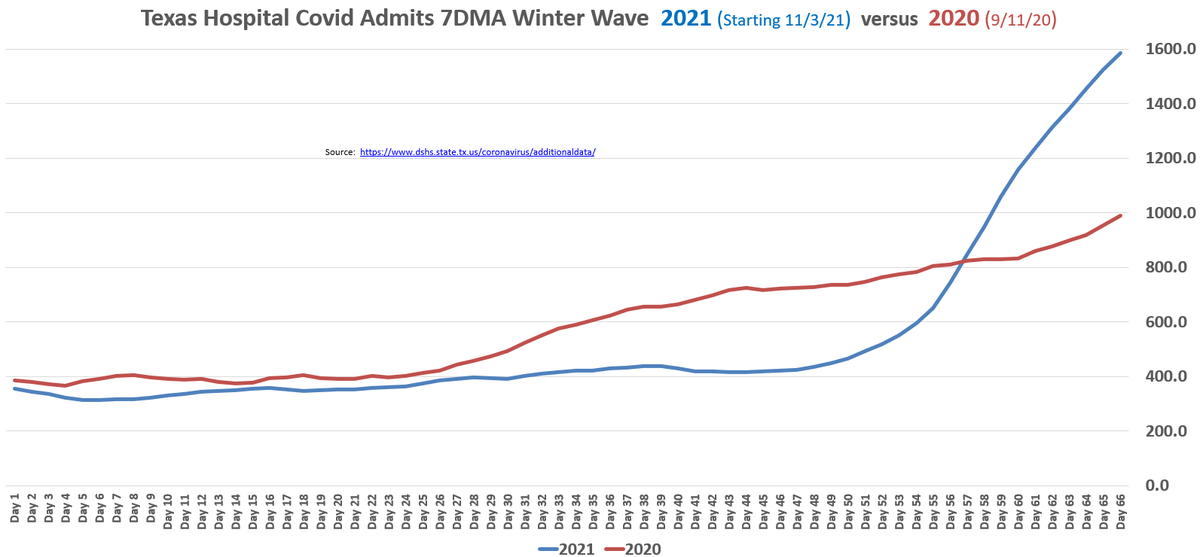
* % of beds tagged as Covid 15.82%, census at 9803
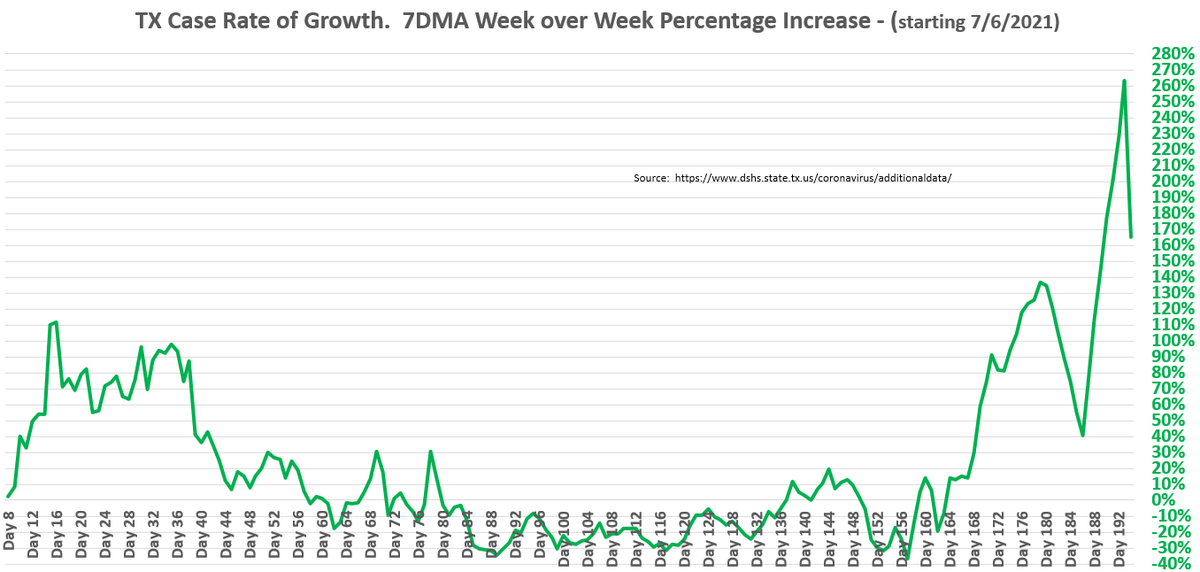
* Admits 7DMA inches up to 1585, but growth rate has really tapered. Down to 49% from 110% just 6 days ago
* Gen hospitalizations growth rate is following suit as per graph 4 below.
4/n
.


* % of beds tagged as Covid 15.82%, census at 9803
* Admits 7DMA inches up to 1585, but growth rate has really tapered. Down to 49% from 110% just 6 days ago
* Gen hospitalizations growth rate is following suit as per graph 4 below.
4/n
.


1/8 Hospitalizations - Part 2
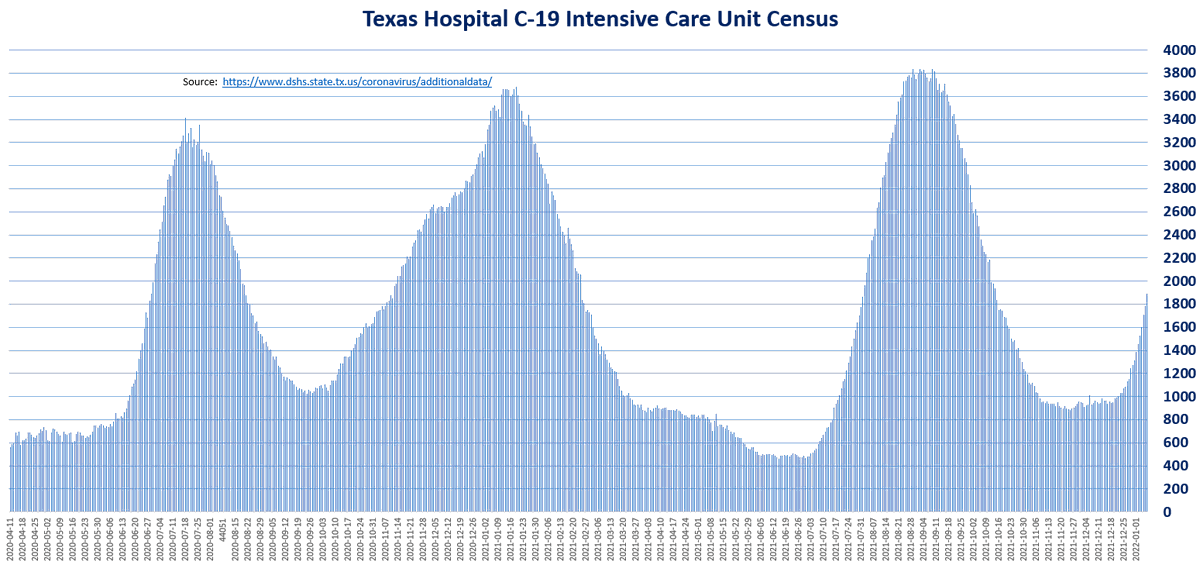
* ICU still yet to catch 2020 Winter wave
* ICU portion of the bed census 1889
* Vent usage even further behind 2020 Winter than ICU
* Continues to be very low severity compared to past waves
5/n
.


* ICU still yet to catch 2020 Winter wave
* ICU portion of the bed census 1889
* Vent usage even further behind 2020 Winter than ICU
* Continues to be very low severity compared to past waves
5/n
.



1/8 Conclusion
* As we get further away from the holidays, test & case numbers will be more indicative of where we are in this wave
* But all indications point to mid-peak+: Upcoming rates of conversion of pos tests to cases, hosps already slowing down rate of growth, etc
6/end
* As we get further away from the holidays, test & case numbers will be more indicative of where we are in this wave
* But all indications point to mid-peak+: Upcoming rates of conversion of pos tests to cases, hosps already slowing down rate of growth, etc
6/end
• • •
Missing some Tweet in this thread? You can try to
force a refresh


