1/30 - Texas C19 Wave Severity Analysis
THREAD:
Now that we are on the backside of this wave, we can start to focus on severe outcomes and comparisons to previous waves. Well look at
* General Hospitalizations
* ICU
* Vents
* Fatalities
* CFR
1/n
THREAD:
Now that we are on the backside of this wave, we can start to focus on severe outcomes and comparisons to previous waves. Well look at
* General Hospitalizations
* ICU
* Vents
* Fatalities
* CFR
1/n
1/30 TX Severe outcomes - Page 2
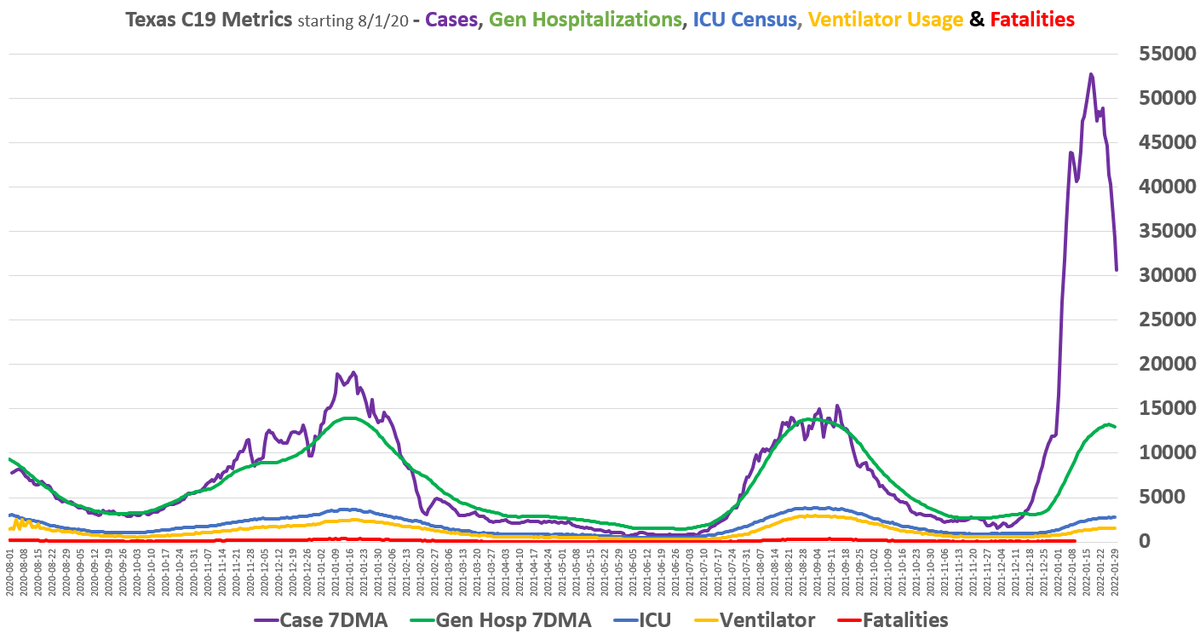
* We'll start with a view of all metrics, including Cases
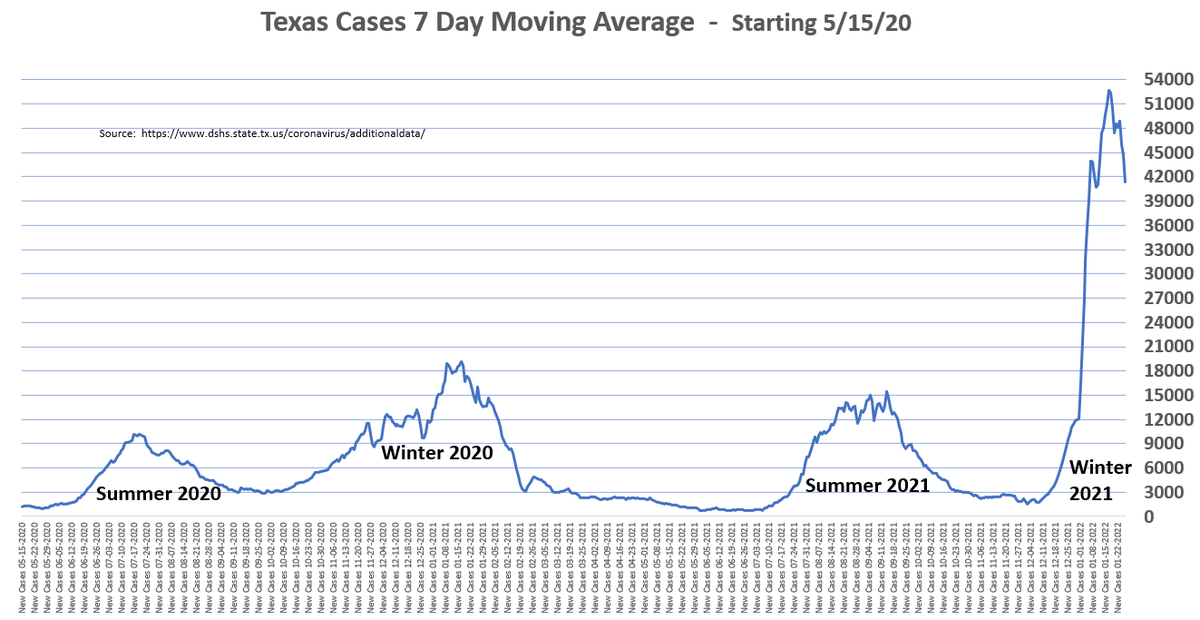
* Obviously the 2021 Winter Wave was nothing like we've seen before in regards to Cases
* However, general hospitalizations peaked slightly below the previous 2 waves
#Casedemic
2/n
* We'll start with a view of all metrics, including Cases
* Obviously the 2021 Winter Wave was nothing like we've seen before in regards to Cases
* However, general hospitalizations peaked slightly below the previous 2 waves
#Casedemic
2/n

1/30 TX Severe outcomes - Page 3
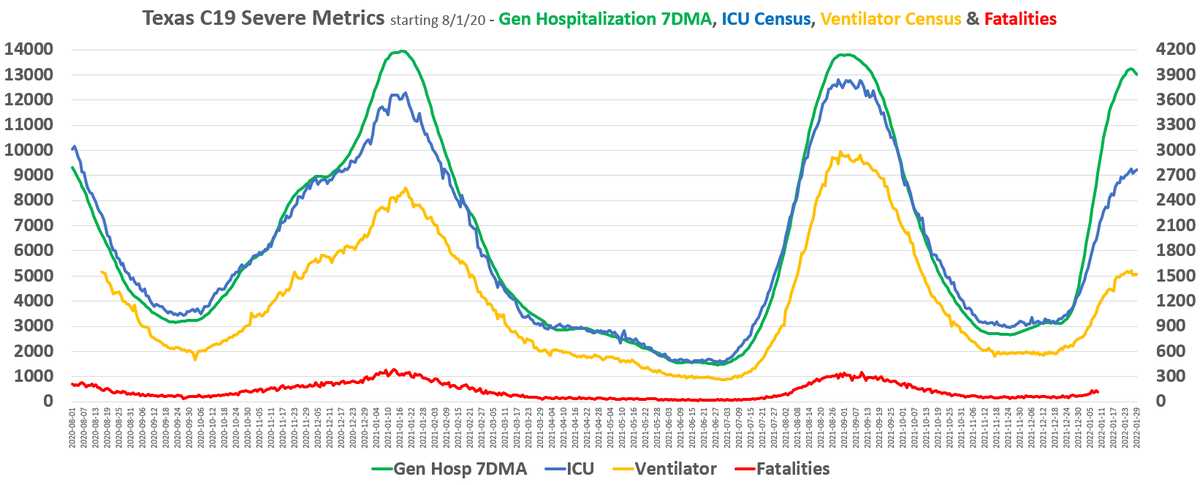
* If we eliminate cases, the hospitalization metrics become clear
* Left axis = gen hospitalizations
* Right axis = ICU, Vents, Fatalities
* While Gen hosps are similar, ICU/Vents are going to peak SIGNIFICANTLY lower than previous two waves
3/n
* If we eliminate cases, the hospitalization metrics become clear
* Left axis = gen hospitalizations
* Right axis = ICU, Vents, Fatalities
* While Gen hosps are similar, ICU/Vents are going to peak SIGNIFICANTLY lower than previous two waves
3/n

1/30 TX Severe outcomes - Page 4
* My tried & true Gen Hospitalizations vs Fatalities chart
* Due to how delayed fatality reporting is, 12/23 - 1/8 fatalities below are projections, and chart doesn't show Jan 9 to now.
* You can see historically how close they charted
4/n
* My tried & true Gen Hospitalizations vs Fatalities chart
* Due to how delayed fatality reporting is, 12/23 - 1/8 fatalities below are projections, and chart doesn't show Jan 9 to now.
* You can see historically how close they charted
4/n

1/30 TX Severe outcomes - Page 5
* Case Fatality Rate (CFR) is the rate of cases sent to the State DSHS vs Fatalities attributed to C19
* CFR differs from Infection Fatality Rate (IFR) which estimates all infection - asymptomatic, mildly symptomatic, home tests, etc
5/n
* Case Fatality Rate (CFR) is the rate of cases sent to the State DSHS vs Fatalities attributed to C19
* CFR differs from Infection Fatality Rate (IFR) which estimates all infection - asymptomatic, mildly symptomatic, home tests, etc
5/n

1/30 TX Severe outcomes - Page 6
* CFR has hovered between 1.5% & 3% throughout the pandemic
* But look where CFR is through Jan 9 of Omicron. Dec 23 - Jan 9 again is projected based on past arrival analysis. Its not going to change much. I'm not projecting past Jan 9
6/n
* CFR has hovered between 1.5% & 3% throughout the pandemic
* But look where CFR is through Jan 9 of Omicron. Dec 23 - Jan 9 again is projected based on past arrival analysis. Its not going to change much. I'm not projecting past Jan 9
6/n

1/30 TX Severe outcomes - Page 7
* CFR @ 0.25% is less than flu. Because again, this is cases recorded by the state over fatalities on that day.
* While fatalities lag, and CFR will assuredly rise off of 0.25%, CFR has already hit a low 4X lower than any previous wave.
7/n
* CFR @ 0.25% is less than flu. Because again, this is cases recorded by the state over fatalities on that day.
* While fatalities lag, and CFR will assuredly rise off of 0.25%, CFR has already hit a low 4X lower than any previous wave.
7/n

1/30 TX Severe outcomes - Conclusion
It's preliminary, but its already apparent Winter 2021 was a severe casedemic. Its flu numbers. That's not my opinion, that's the charts. Just realized I need to cite them, they are all sourced right here.
8/end
dshs.state.tx.us/coronavirus/ad…
It's preliminary, but its already apparent Winter 2021 was a severe casedemic. Its flu numbers. That's not my opinion, that's the charts. Just realized I need to cite them, they are all sourced right here.
8/end
dshs.state.tx.us/coronavirus/ad…
• • •
Missing some Tweet in this thread? You can try to
force a refresh


