A little thread on the Great Disinformer @ianmSC
Why Real Science™ isn't done with MSPaint charts.
His charts seem to claim that nothing works. Locking down doesn't work, masking doesn't work, vaccination doesn't work, your printer doesn't wo—wait scratch that one
1/n
Why Real Science™ isn't done with MSPaint charts.
His charts seem to claim that nothing works. Locking down doesn't work, masking doesn't work, vaccination doesn't work, your printer doesn't wo—wait scratch that one
1/n
One iota of critical thinking is all you need to expose numerous errors in his charts:
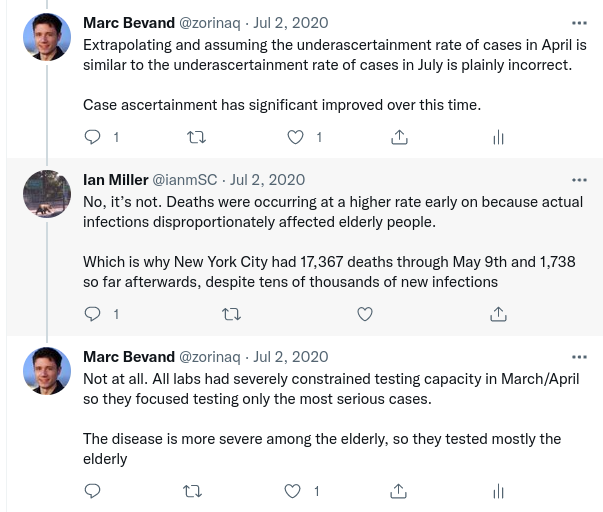
Error #1 — Case ascertainment rate bias:
A country may detect 1 in 2 cases, while another 1 in 4. We say the case ascertainment rate is respectively 50%, and 25%.
Error #1 — Case ascertainment rate bias:
A country may detect 1 in 2 cases, while another 1 in 4. We say the case ascertainment rate is respectively 50%, and 25%.
This variance in case ascertainment rate alone is enough to put half of @ianmSC's charts where they belong: in the trash🗑️
Real Science™ looks at covid deaths—not cases—to compare the severity of the pandemic across different regions. This avoids case ascertainment rate bias.
Real Science™ looks at covid deaths—not cases—to compare the severity of the pandemic across different regions. This avoids case ascertainment rate bias.
Error #2 — Fails to consider the counterfactual:
Without lockdowns, without masks, without NPIs, we have quite solid evidence by now that the situation would be even worse. See published Real Science™:
Without lockdowns, without masks, without NPIs, we have quite solid evidence by now that the situation would be even worse. See published Real Science™:
https://twitter.com/zorinaq/status/1490818743588384768
If infections continue to accelerate after a measure (eg. masking) is enacted, it doesn't imply that the measure is ineffective
Often, authorities enact a measure when they see a growing threat (eg. arrival of a more infectious variant).
Often, authorities enact a measure when they see a growing threat (eg. arrival of a more infectious variant).
The counterfactual in this case, a more infectious variant arriving WITHOUT a measure in place, would mean infections accelerating even more than they are growing WITH the measure.
Error #3 — Apples🍎 to Oranges🍊
That's something @ianmSC loves to do. He compares country X to country Y, slaps labels on a chart ("X had mask mandates", "Y didn't"). Somehow he thinks the observed differences in pandemic severity is due to only that one thing (masks)
That's something @ianmSC loves to do. He compares country X to country Y, slaps labels on a chart ("X had mask mandates", "Y didn't"). Somehow he thinks the observed differences in pandemic severity is due to only that one thing (masks)
@ianmSC But in reality a multitude of other factors matter just as much:
- population health
- density
- household size
- ingress of visitors (who seed infections)
- even income disparity, education... are big factors that correlate to covid deaths per capita
@ianmSC ignores all that
- population health
- density
- household size
- ingress of visitors (who seed infections)
- even income disparity, education... are big factors that correlate to covid deaths per capita
@ianmSC ignores all that
@ianmSC Error #4 - Logic/math errors
@ianmSC believes that adding the infection rate per capita across different vaccinated populations (1 dose, and 2 doses) gives the infection rate in the overall vaccinated population
High-school math fail🤦♂️
@ianmSC believes that adding the infection rate per capita across different vaccinated populations (1 dose, and 2 doses) gives the infection rate in the overall vaccinated population
High-school math fail🤦♂️
https://twitter.com/thereal_truther/status/1466178672608485376
@ianmSC Now, someone having such a severe misunderstanding of basic rate calculations explains why @ianmSC never takes the discussion one level beyond just presenting a simplistic chart... I don't think he feels comfortable doing it
@ianmSC Another logic error:
On an occasion where @ianmSC seemed cognizant of the case ascertainment rate (the 11x factor below), he thought it was a constant that didn't change through time
On an occasion where @ianmSC seemed cognizant of the case ascertainment rate (the 11x factor below), he thought it was a constant that didn't change through time
https://twitter.com/zorinaq/status/1278927477067231233

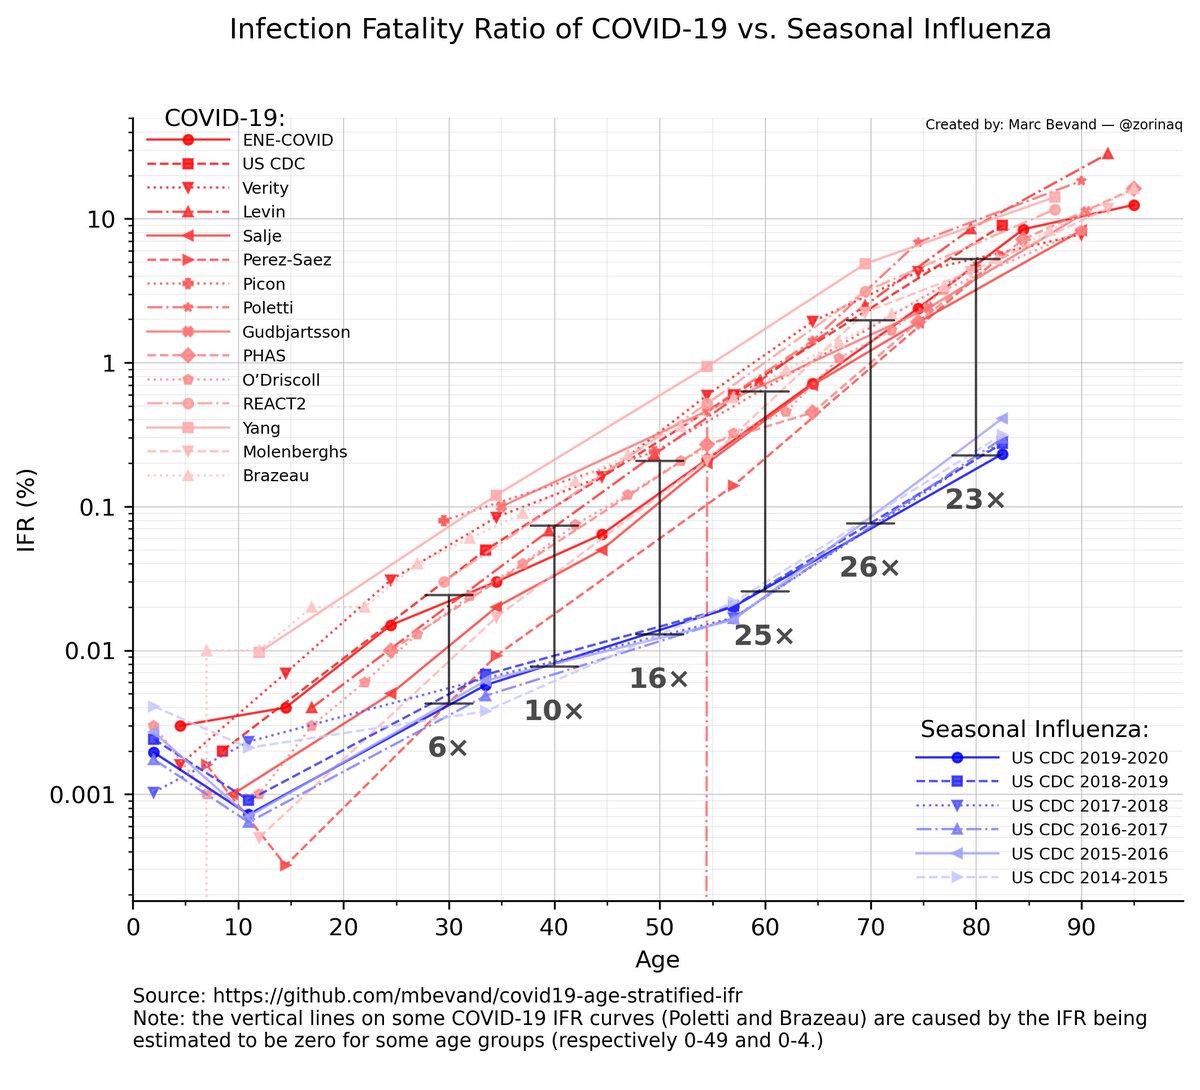
@ianmSC Another logic error (3rd one): he compute the IFR incorrectly by failing to account for some lags
https://twitter.com/ianmSC/status/1278934847923220481

• • •
Missing some Tweet in this thread? You can try to
force a refresh