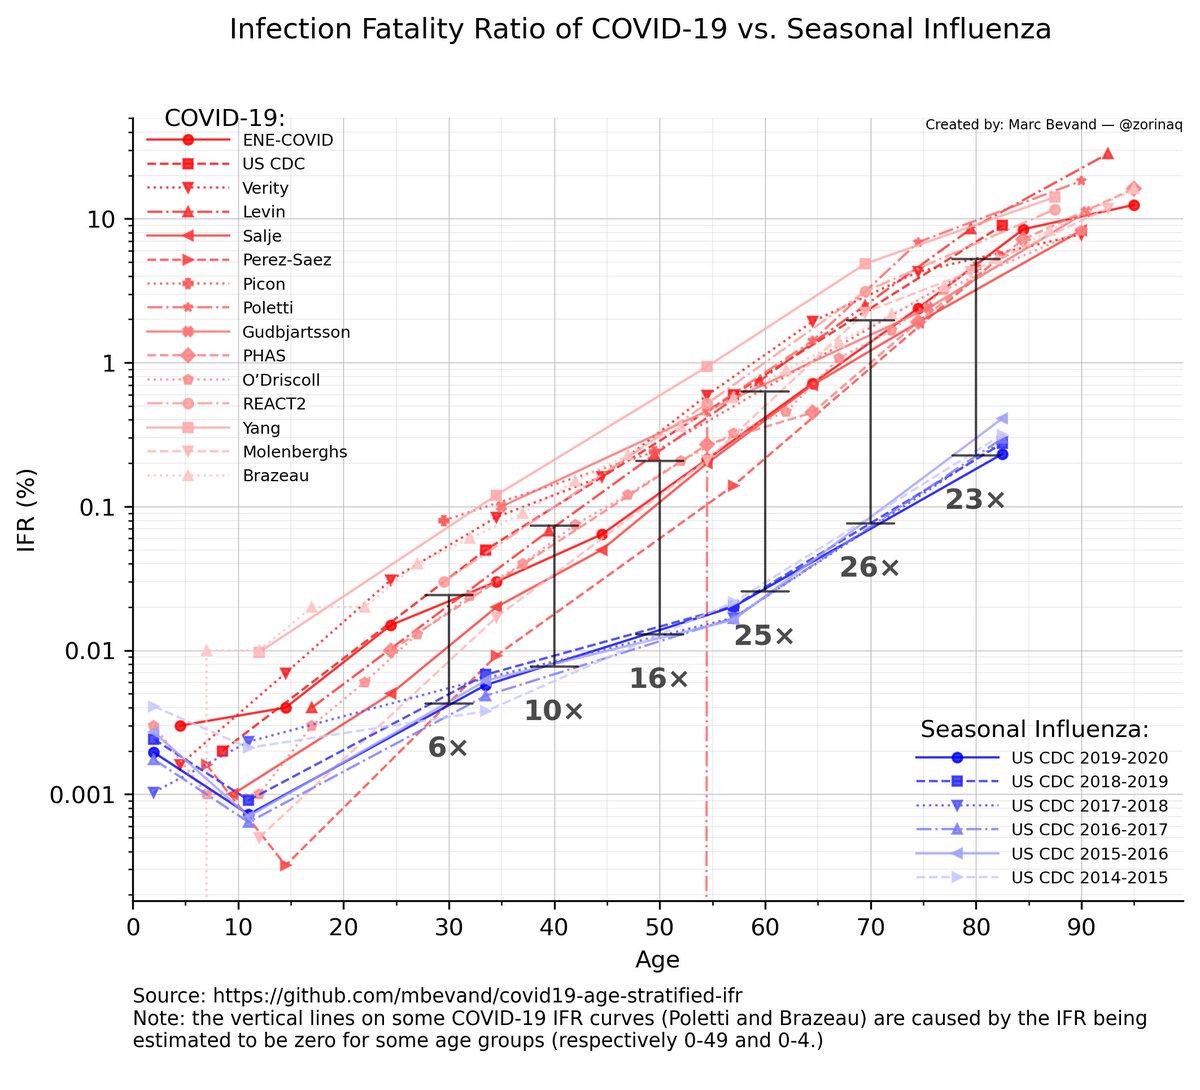
I updated my chart comparing the fatality of covid vs flu

(data & source code: github.com/mbevand/covid1…)

Notice the new curve "Brazeau" which is 1 of the most comprehensive & recent analysis suggesting covid is more fatal than the flu even at ages as young as 5 years old Image
All the official sources behind this chart are referenced in the README file:
github.com/mbevand/covid1… Image
The US CDC did update their estimate of the covid IFR on 19 March 2021 (they increased it quite significantly). I missed that update.

Here is the chart with that latest update: Image
I'd like to thank @MartinJuhl2 who pointed me to the paper by Brazeau et al.

• • •

Missing some Tweet in this thread? You can try to force a refresh
 

Keep Current with Marc Bevand

Marc Bevand Profile picture

Stay in touch and get notified when new unrolls are available from this author!

Read all threads

This Thread may be Removed Anytime!

PDF

Twitter may remove this content at anytime! Save it as PDF for later use!

Try unrolling a thread yourself!

how to unroll video
  1. Follow @ThreadReaderApp to mention us!

  2. From a Twitter thread mention us with a keyword "unroll"
@threadreaderapp unroll

Practice here first or read more on our help page!

More from @zorinaq

17 Feb
A good track record is everything. If you don't have a good one, you are a bad analyst.

With that in mind, let's examine some of @MLevitt_NP2013's analyses and predictions

1/n
Michael claimed Italy would end at 17k-20k deaths ()

Observed: 94k & and counting

Wrong by 5-fold

2/n
Michael claimed Switzerland would have approximately 500 deaths ()

Observed: 9k deaths & counting

Wrong by 18-fold

3/n
Read 9 tweets
25 Jan
Sweden mortality over the last 120 years.

This week's update from SCB takes Sweden to 𝟵𝟴,𝟬𝟴𝟭 deaths recorded in year 2020. The country's seeing the worst excess mortality since the 1918 pandemic flu.

1/n
Source: scb.se/en/finding-sta…

Above link is found under "Preliminary statistics on deaths" at scb.se/en/finding-sta…

2/n
Covid denialist: "but it's not population-adjusted"

Yes it is. Panels (A) and (B) are population-adjusted.

3/n
Read 4 tweets
19 Jan
Sweden mortality from 1900 to 2020.

This week's data update from SCB puts Sweden past a sad milestone: year 2020 recorded both the most excess *deaths* as well as the highest excess *mortality* (population adjusted) since the 1918 flu pandemic.

Let this sink in.

1/n
Source: scb.se/en/finding-sta…

This is the link found under "Preliminary statistics on deaths" at scb.se/en/finding-sta…

2/n
My estimate of ~7200 excess deaths is roughly confirmed by SCB who, as of a few weeks ago, estimated approximately 7000: dn.se/sverige/sverig… .

3/n
Read 4 tweets
11 Jan
Latest official Swedish population stats: 𝟵𝟳,𝟭𝟲𝟰 preliminary deaths recorded in 2020

As per my analysis year 2020 has:
➡️highest excess mortality since 1931 (population-adjusted)
➡️most excess deaths since 1918 flu pandemic
➡️highest absolute mortality since 2013

#sweden
Source: scb.se/en/finding-sta…

Which is the link found under "Preliminary statistics on deaths (published 2021-01-11)" at scb.se/en/finding-sta… .
Final figures for 2020 will be known around February 2021 and will probably stabilize around high 97,000s or low 98,000s total deaths.
Read 4 tweets
22 Dec 20
Here's my weekly update from SCB on mortality in Sweden.

Year 2020 has:
(1) the highest excess mortality since 1937 (pop. adjusted)
(2) the most excess deaths since 1919 (not pop. adjusted)
(3) annulled 7 years of all-cause mortality decline (highest ACM since 2013)

1/n
For their part, the Swedish government estimates 4859 as of 30 Nov:

2/n
The line representing average expected mortality on my chart is a LOWESS regression

Normally demographers use more sophisticated statistical algorithms (eg. Farrington) to do so. LOWESS is a sloppy technique, but it works well enough for rough estimates

3/n
Read 4 tweets
30 Nov 20
The timing of when self-sustained transmission starts is crucial:

A and B are 2 identical countries implementing the same lockdown policy at the same time

If self-sustained transmission starts 𝟱 𝗱𝗮𝘆𝘀 𝗲𝗮𝗿𝗹𝗶𝗲𝗿 in A, then A will have 𝘁𝘄𝗶𝗰𝗲 the number of deaths
This is just math, based on various estimates that the epidemic doubling time of COVID was less than 5 days before lockdowns in spring 2020
academic.oup.com/jid/article/22…
In fact, because of this short doubling time, the timing between self-sustained transmission and lockdown is one of the most important factors that determines cumulative deaths per capita

This explains NYC and the Nordic countries. See next tweet.
Read 4 tweets

Did Thread Reader help you today?

Support us! We are indie developers!


This site is made by just two indie developers on a laptop doing marketing, support and development! Read more about the story.

Become a Premium Member ($3/month or $30/year) and get exclusive features!

Become Premium

Too expensive? Make a small donation by buying us coffee ($5) or help with server cost ($10)

Donate via Paypal Become our Patreon

Thank you for your support!

Follow Us on Twitter!

:(