Let's pick apart this preprint and see if Peter's claim holds.
I spent less than 1 minute scanning it, and I'm pretty sure it is flawed, but I'm going to review it live on Twitter
I spent less than 1 minute scanning it, and I'm pretty sure it is flawed, but I'm going to review it live on Twitter
https://twitter.com/peterktodd/status/1438924954637148166
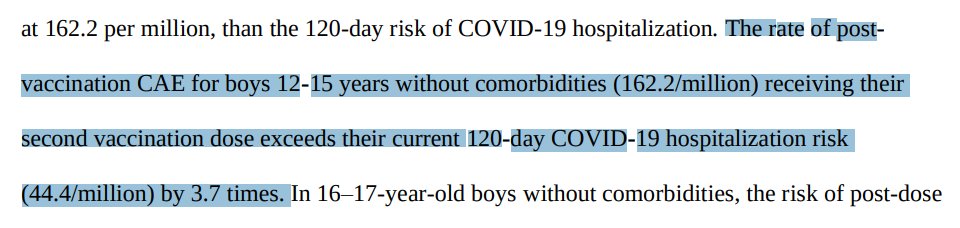
Peter highlights "For boys 16-17 without medical comorbidities, the rate of CAE is currently 2.1 to 3.5 times higher than their 120-day COVID-19 hospitalization risk"
CAE = cardiac adverse event
CAE = cardiac adverse event

First, the claim is very specific:
- not all kids, just boys
- not all boys, just 16-17
- not 16-17 boys, just those with zero medical comorbidities
So, from the get go, this implies all other kids could probably still be vaccinated and this being less risky than COVID-19 itself
- not all kids, just boys
- not all boys, just 16-17
- not 16-17 boys, just those with zero medical comorbidities
So, from the get go, this implies all other kids could probably still be vaccinated and this being less risky than COVID-19 itself
Secondly, is a CAE comparable to being hospitalized for COVID-19?
The CAE is defined as one of those cardiac arrest events:
The CAE is defined as one of those cardiac arrest events:

So simply having some slight chest pain with slightly slow heart beat (55 bpm which is "abnormal echocardiogram") would be a CAE
And Peter equates this to a kid being hospitalized with COVID-19 !
And Peter equates this to a kid being hospitalized with COVID-19 !
Secondly, the source of information of these CAE is VAERS.
And VAERS doesn't establish causal relationship, often contains errors, etc.
And VAERS doesn't establish causal relationship, often contains errors, etc.
BRB, I'm picking up my kid from school
Back on my computer. Continuing the thread...
Another looming suspicion I had is now confirmed. See figure 6, notice anything strange?
Another looming suspicion I had is now confirmed. See figure 6, notice anything strange?
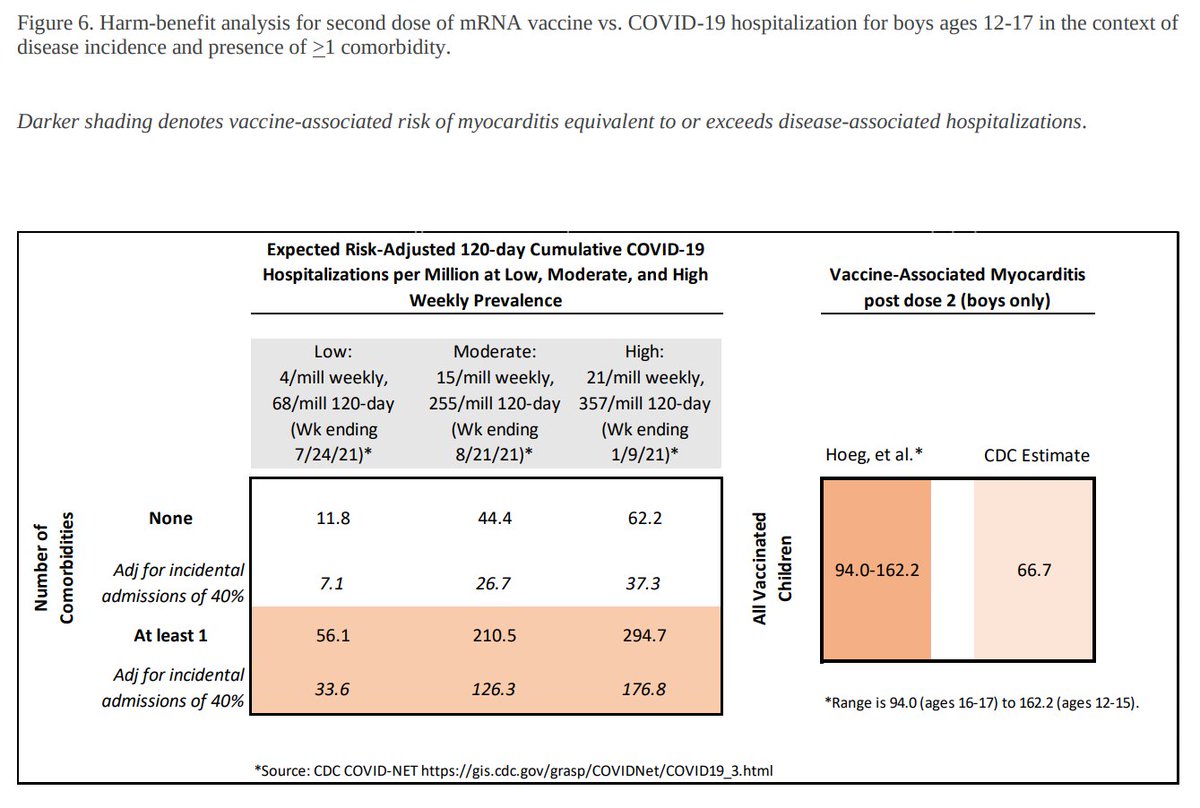
Read figure 6 along with this text below. Does it make it easier to see what they did wrong?

The authors compare the CAE rate of all kids (including those with comorbidities) to the COVID hospitalization rate of kids without comorbidities
With vs without comorbidities
Apples vs oranges🤦
With vs without comorbidities
Apples vs oranges🤦
There is no need to continue the review. I, a non-expert, was able to find enough flaws to undermine the validity of this preprint.
And these flaws are the reason this preprint will never be published as it will never pass even a casual peer-review.
And these flaws are the reason this preprint will never be published as it will never pass even a casual peer-review.
I see some experts have already given it a look, and found even more problems:
https://twitter.com/GidMK/status/1437241913677991937
There are also glaring inconsistencies in the data.
Figure 6 left panel claims to represent kids 12-17
But a paragraph quotes fig 6's numbers as applying to "boys 16-17"
And yet another paragraph quotes fig 6's numbers applying to "boys 12-15"
Inconsistencies everywhere...
Figure 6 left panel claims to represent kids 12-17
But a paragraph quotes fig 6's numbers as applying to "boys 16-17"
And yet another paragraph quotes fig 6's numbers applying to "boys 12-15"
Inconsistencies everywhere...


So which is it? Is figure 6 (left panel) for all kids 12-17? Just boys 12-17? Just boys 12-15? Just boys 16-17?
Who knows?
Garbage in, garbage out!
Who knows?
Garbage in, garbage out!
• • •
Missing some Tweet in this thread? You can try to
force a refresh