BTCfuel Profile picture
Feb 11 5 tweets 4 min read
#Bitcoin and #Altcoins have a different cycle length

They were almost aligned in 2017, but are now shifting apart. I believe #altcoins will peak before #Bitcoin.

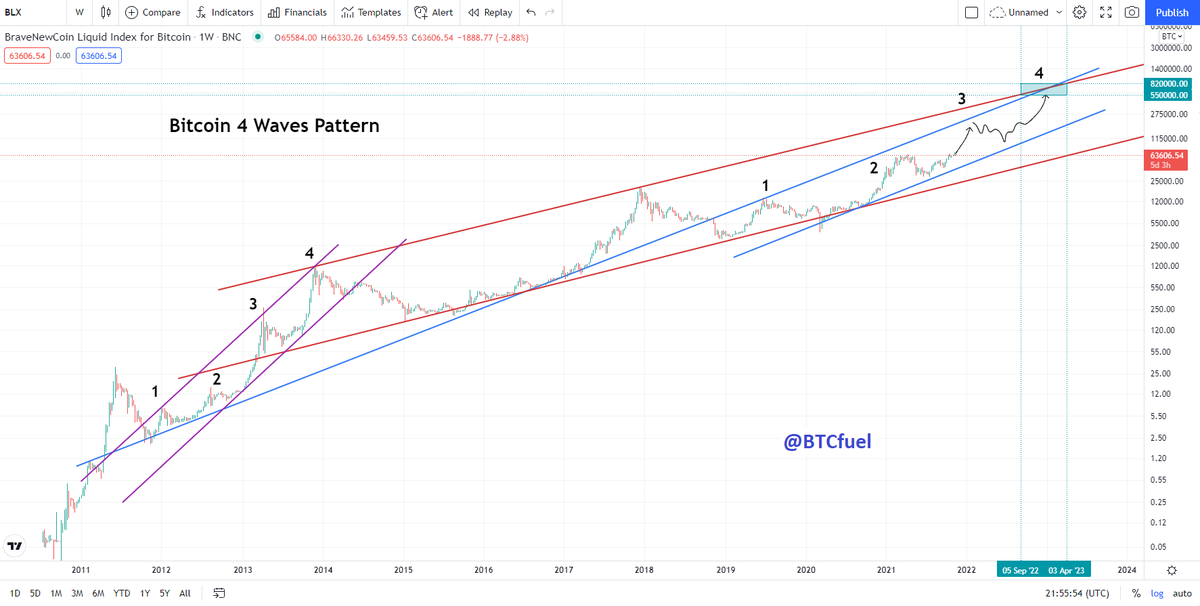
These are the patterns I'm looking at right now to have an idea where altcoins and Bitcoin could be heading to. Image
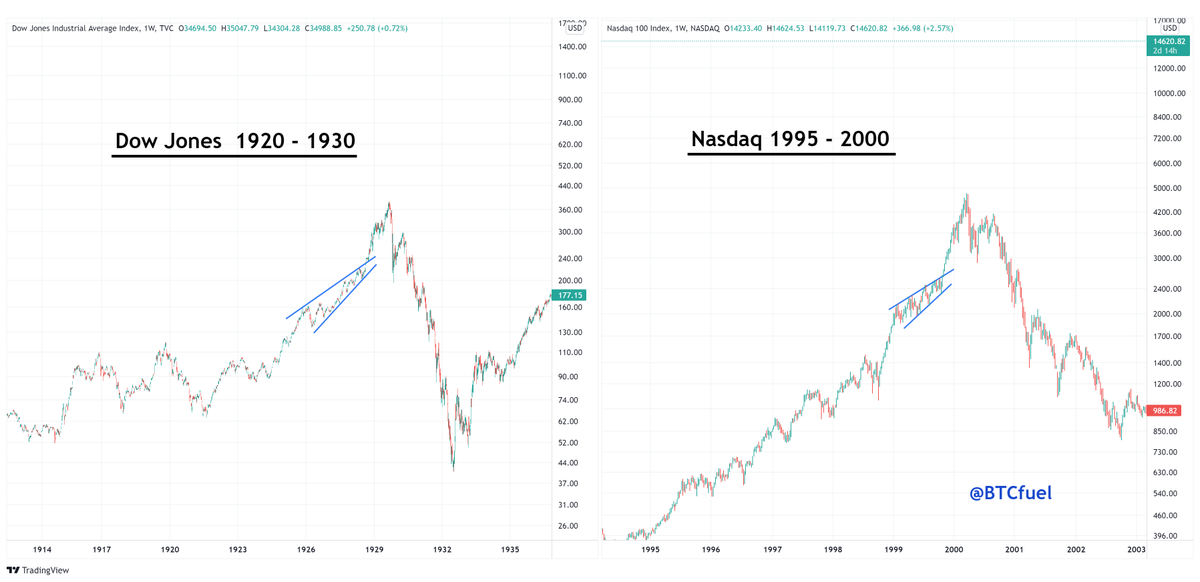
#Altcoins are in the hype phase, like Dotcom bubble Nasdaq and Bitcoin 2010-2014

#Bitcoin is now its lifoff phase following Gold 1999-2011 in the same phase Image
The NASDAQ pattern is an interesting example for #Altcoins because both are 2 hyper-innovative techmarkets with an enormous size. Because of the size and same characteristics it wouldn't suprise me that history will repeat, like it always does

The risk-on vs risk-off difference for #Bitcoin and #Altcoins in this period is also an important reason why I think they will peak at differents moments in time

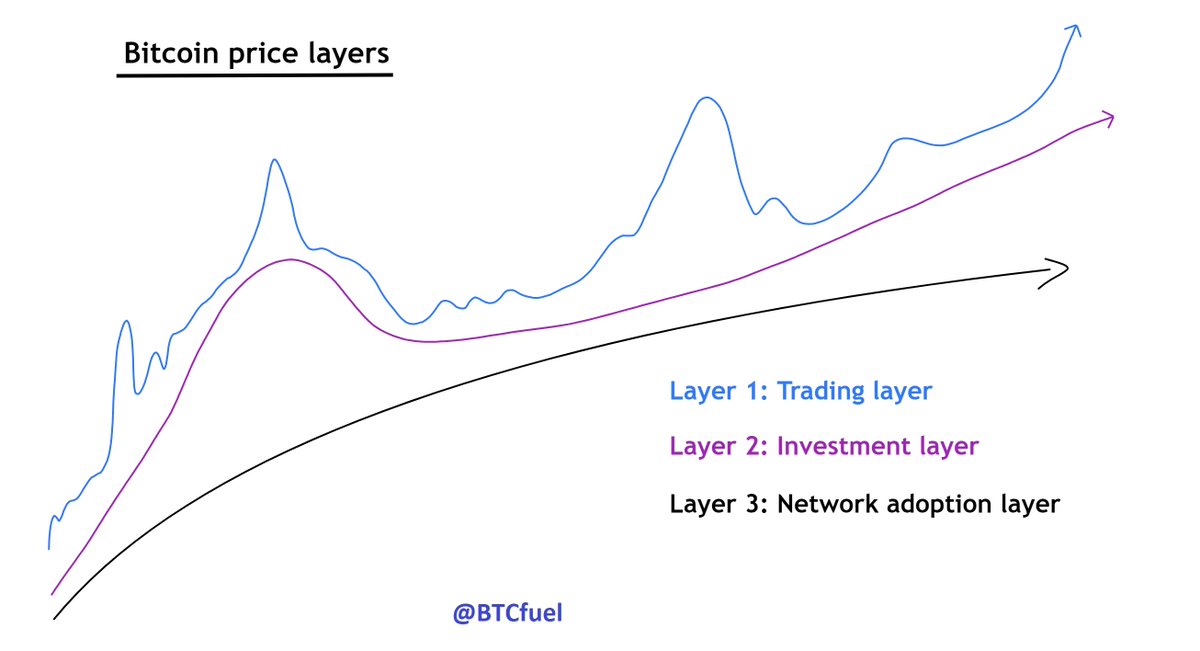
To be complete, this is the "market curve" for gold vs #Bitcoin. So for now I'm looking 1999 - 2011 gold for Bitcoin to follow

• • •

Missing some Tweet in this thread? You can try to force a refresh
 

Keep Current with BTCfuel

BTCfuel Profile picture

Stay in touch and get notified when new unrolls are available from this author!

Read all threads

This Thread may be Removed Anytime!

PDF

Twitter may remove this content at anytime! Save it as PDF for later use!

Try unrolling a thread yourself!

how to unroll video
  1. Follow @ThreadReaderApp to mention us!

  2. From a Twitter thread mention us with a keyword "unroll"
@threadreaderapp unroll

Practice here first or read more on our help page!

More from @BTCfuel

Feb 16
#Bitcoin & #Altcoins mini-thread

In this short thread I share valuable insights in the mid term and long term market structure for #Bitcoin & #Altcoins
Every #Bitcoin bull market / parabola has 3 consolidation stages. The further the bull market progresses, upwards pressure increases, the more these structures start pointing upwards

Bitcoin is now in the neutral stage. The rising wedge is the structure before the final run
The rising wedge before the top also happened in other markets such as the Dow Jones in the 20's and the during the Dotcom bubble of the NASDAQ
Read 14 tweets
Feb 9
1/ #Bitcoin price thread: 2022 and beyond

In this thread I am dissecting the #Bitcoin price with a ton of insights. I will also share my vision where the Bitcoin is heading and how the Bitcoin price will behave in the future!
2/ The basic thought throughout this thread is this. When you are looking at the #Bitcoin price you are looking at a superposition of investment behaviors. This way I identified 3 major layers. The Bitcoin price is the combination of 3 layers or behaviors
3/ Layer 3 is the base layer. Over time the world will adopt the #Bitcoin network. Layer 3 is about this adoption. This adoption is similar to the network adoption of e.g. the internet or Facebook. Layer 3 is the main support of the bitcoin price (bottom chart @raoulgmi)
Read 28 tweets
Jan 23
Who's ready for an insane #altseason?
A short thread about how #Bitcoin is right now setting up for a historic altseason and second part of cycle
Most people do not realize Bitcoin is still very early in it's cycle. Compared to last cycle, crypto is now between what I call wave 2 and 3. Wave 3 in 2017 happened in the spring of 2017 with an insane altseason and alts outperforming #Bitcoin
I believe the low volume is an indication of the silence before the storm
Read 14 tweets
Dec 30, 2021
1/16 Understanding signal and its energy

In this thread I explain in an easy way the importance of understanding signal and its energy. Conceptual thinking in terms of signal and energy will give you deeper understanding of Bitcoin, the (crypto) markets and indicators Image
2/16 What is a signal actually?

A good definition for a signal is: “meaningful information that you are trying to detect”

The part that is not signal, one calls noise: “random, unwanted variation or fluctuation that interferes with the signal” Image
3/16 A signal can take on many different forms. Any type of quantity can be a signal Image
Read 16 tweets
Nov 19, 2021
1/50 Bitcoin 550k – 820k cycle top prediction
In this thread I share my analysis and a realistic scenario how Bitcoin could possibly go to 550k-820k this cycle between Sep 2022 - Apr 2023 because of its characteristic 4 wave pattern, top lines and lengthening cycles playing out
2/50 The previous picture was Bitcoins 4 wave pattern. Underneath you see bitcoin price prediction with the top lines and Fibonacci extension. All will be explained in this thread
3/50 - 4 wave pattern
Read 50 tweets

Did Thread Reader help you today?

Support us! We are indie developers!


This site is made by just two indie developers on a laptop doing marketing, support and development! Read more about the story.

Become a Premium Member ($3/month or $30/year) and get exclusive features!

Become Premium

Don't want to be a Premium member but still want to support us?

Make a small donation by buying us coffee ($5) or help with server cost ($10)

Donate via Paypal

Or Donate anonymously using crypto!

Ethereum

0xfe58350B80634f60Fa6Dc149a72b4DFbc17D341E copy

Bitcoin

3ATGMxNzCUFzxpMCHL5sWSt4DVtS8UqXpi copy

Thank you for your support!

Follow Us on Twitter!

:(