#Bitcoin & #Altcoins mini-thread
In this short thread I share valuable insights in the mid term and long term market structure for #Bitcoin & #Altcoins
In this short thread I share valuable insights in the mid term and long term market structure for #Bitcoin & #Altcoins

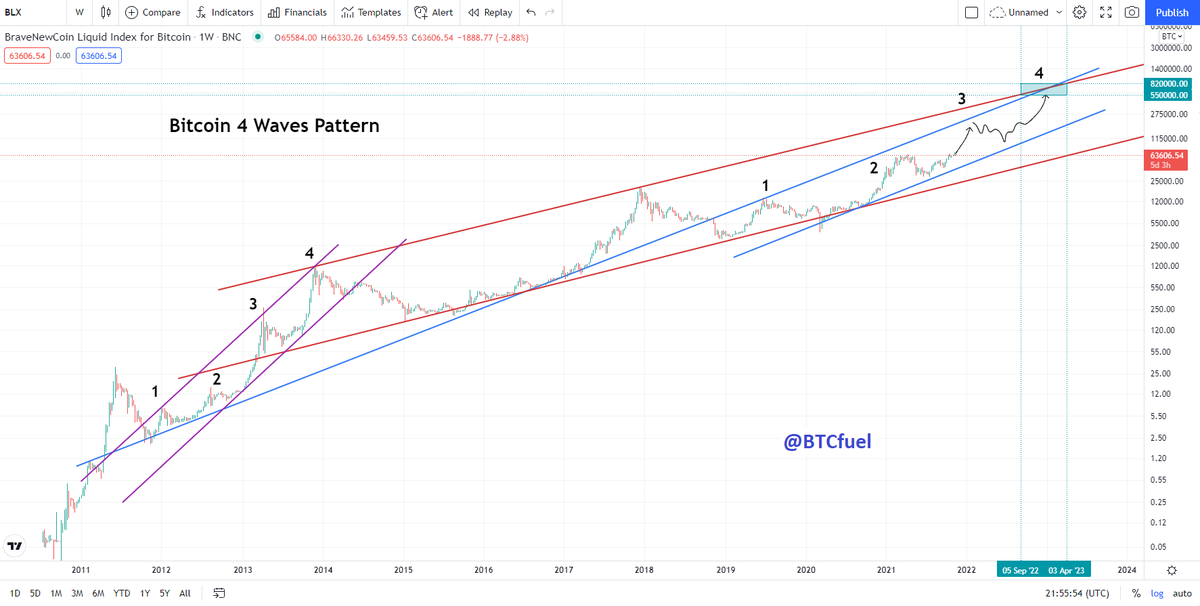
Every #Bitcoin bull market / parabola has 3 consolidation stages. The further the bull market progresses, upwards pressure increases, the more these structures start pointing upwards
Bitcoin is now in the neutral stage. The rising wedge is the structure before the final run
Bitcoin is now in the neutral stage. The rising wedge is the structure before the final run

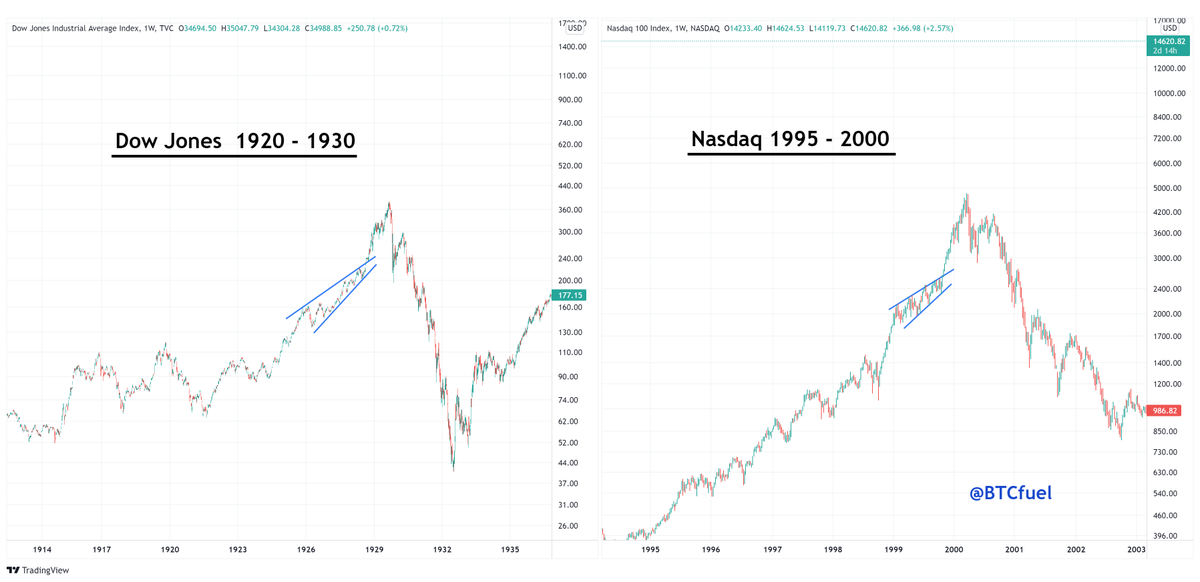
The rising wedge before the top also happened in other markets such as the Dow Jones in the 20's and the during the Dotcom bubble of the NASDAQ 
#Altcoins are already in this rising wedge, the final stage before the top. The peak will happen in 2022 

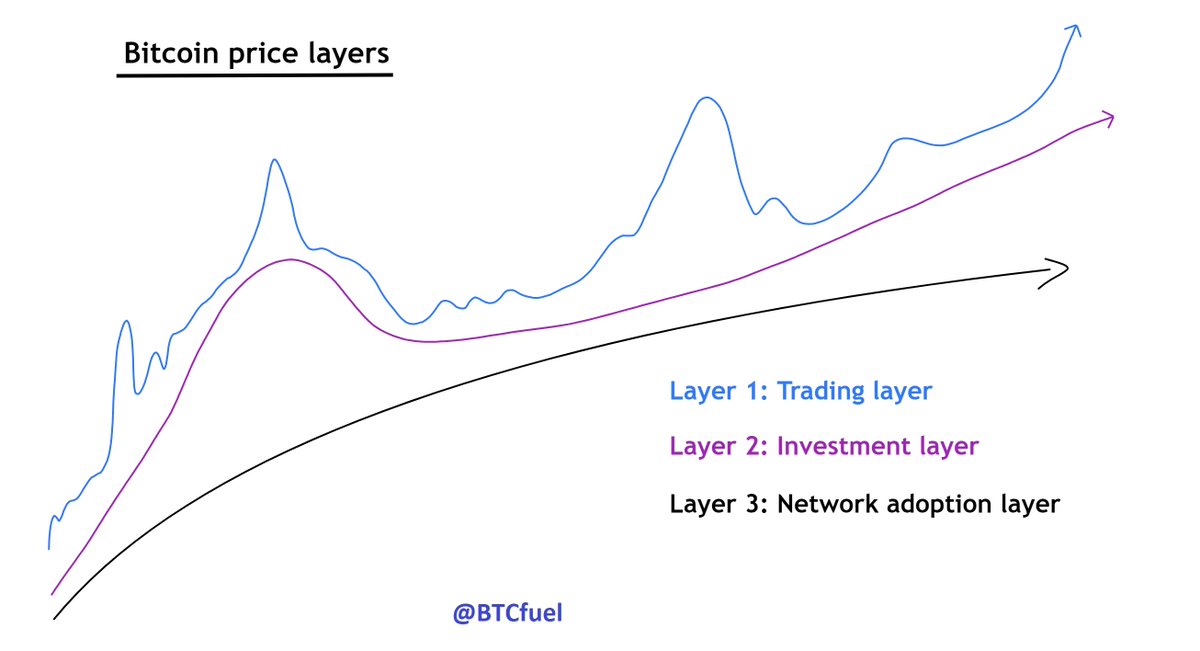
It is important the know that these bull market structures are patterns of long term processes.
#Altcoins are in a huge speculative bubble comparable to the Dotcom bubble. Altcoins are following the Dotcom bubble NASDAQ like a clockwork
#Altcoins are in a huge speculative bubble comparable to the Dotcom bubble. Altcoins are following the Dotcom bubble NASDAQ like a clockwork

#Bitcoin and #Altcoins are at a different stage in their bull market. This is their "Market curve"
Small sidenote: In some analysis I make, I see the 2017 #Bitcoin peak as a deviation. It was more about the crypto markets genesis than about Bitcoin itself
Small sidenote: In some analysis I make, I see the 2017 #Bitcoin peak as a deviation. It was more about the crypto markets genesis than about Bitcoin itself
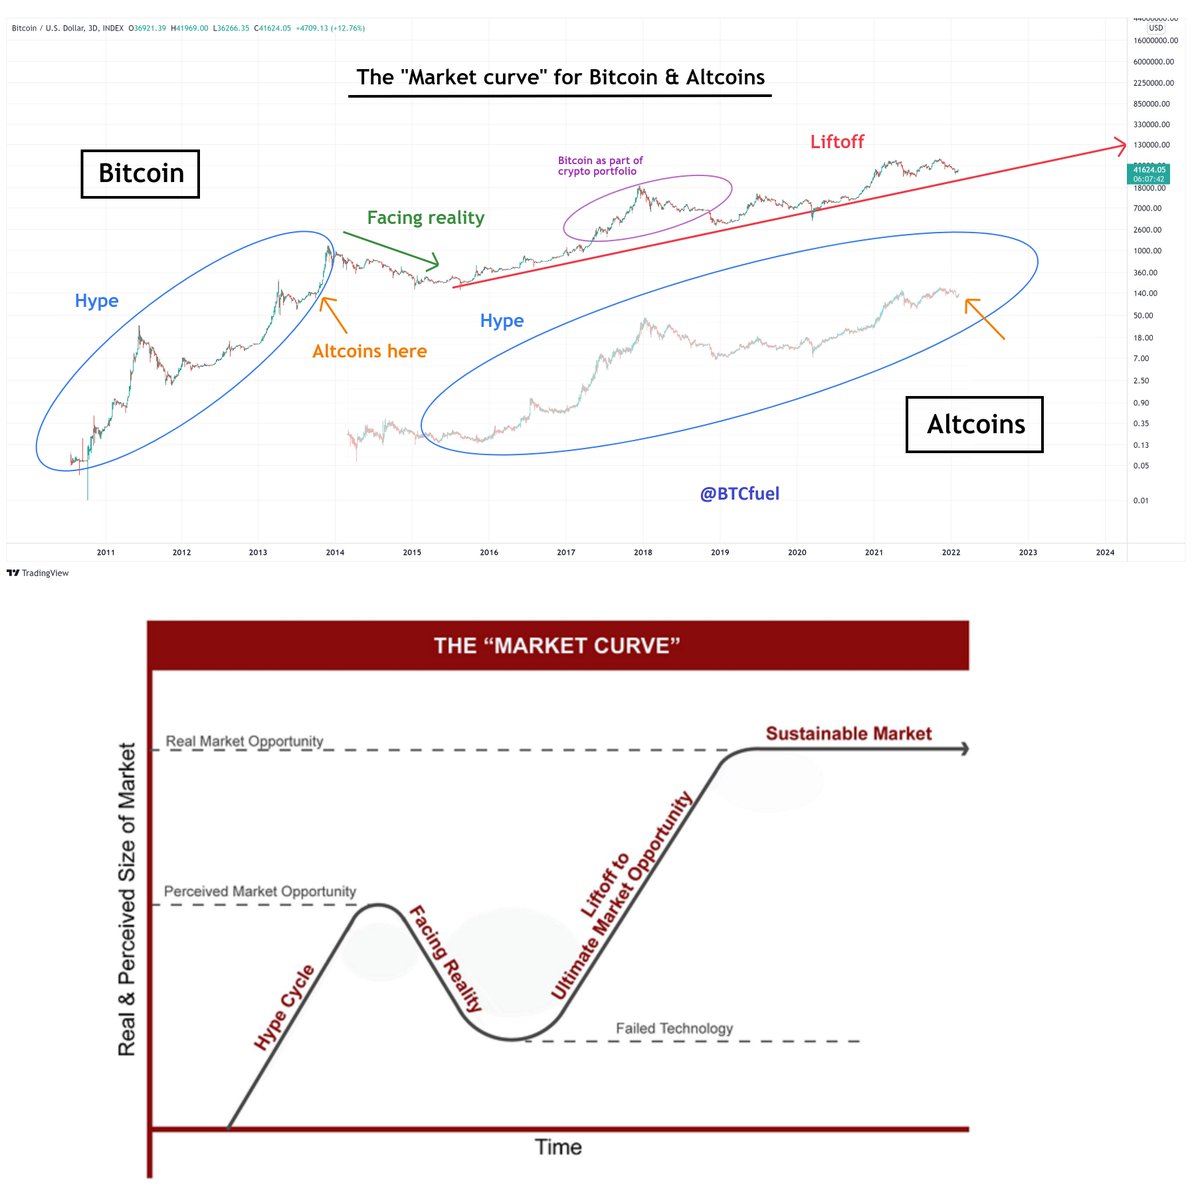
This is an example how I could see both #Bitcoin and #Altcoin markets play out, because they are in different stages in their bull markets 

For #Bitcoin it's also important to know that, in the background, it has been following 1999-2011 gold for already 8 years. This makes much sense because Bitcoin = digital gold
The RSI really gives it away, this indicator is a relative measure that filters out a lot of noise
The RSI really gives it away, this indicator is a relative measure that filters out a lot of noise

But also, #Bitcoin is in the same long term phase right now as 1999-2011 gold if you look at their "Market curve" 

So #Bitcoin is now in this neutral sideways channel. It mean also that it's still far away from its peak. Definitely when you also take the gold pattern in the back in account
The real peak could maybe be programmed for 2026 - 2027, with a local peak in 2023
The real peak could maybe be programmed for 2026 - 2027, with a local peak in 2023
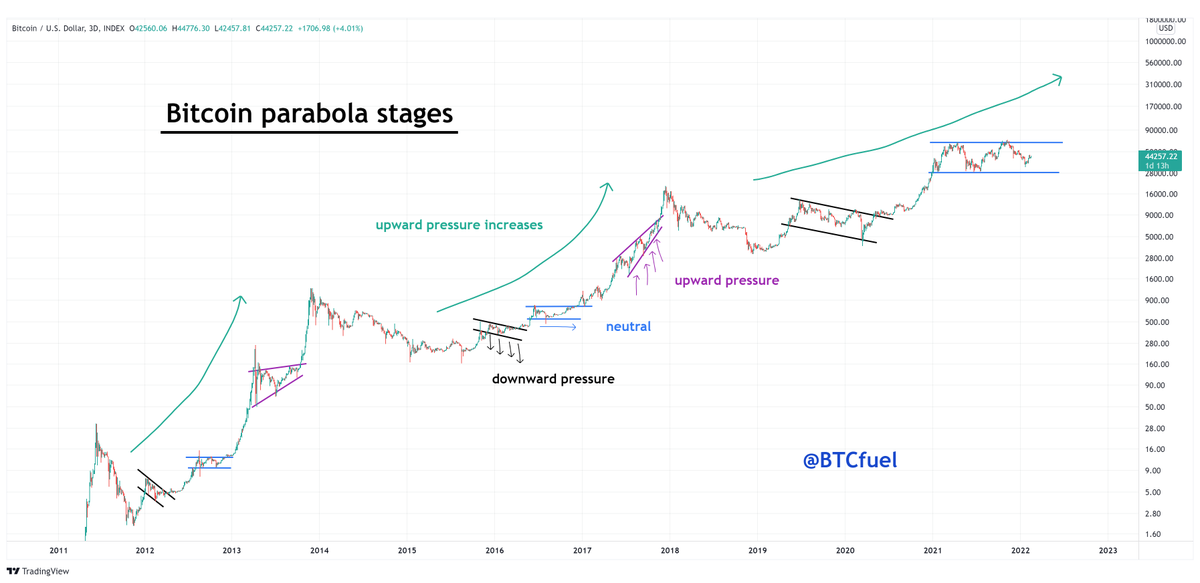
Lets now take a look at the #Bitcoin price in the same stages. The patterns look very similar. Nothing to be worried about!
The fact that these patterns are all very similar means that there is some specific bull market structure going on, because of long term processes
The fact that these patterns are all very similar means that there is some specific bull market structure going on, because of long term processes

For now this is about what I expect for #Bitcoin in 2022. Although Bitcoin is at a different stage. The 2020 pattern looks very similar.
I expect a bump when #altcoins go for their blow off. Because of the correlation of Bitcoin & altcoins, and because a bump happened before
I expect a bump when #altcoins go for their blow off. Because of the correlation of Bitcoin & altcoins, and because a bump happened before

To conclude:
#Bitcoin and #Altcoins are at different stages in their bull run and in their long term market curve
Altcoin peak in 2022, Bitcoin local peak likely in 2023
It is important to compare same stages in the longterm processes and not random patterns
#Bitcoin and #Altcoins are at different stages in their bull run and in their long term market curve
Altcoin peak in 2022, Bitcoin local peak likely in 2023
It is important to compare same stages in the longterm processes and not random patterns
• • •
Missing some Tweet in this thread? You can try to
force a refresh


