People tend to oversimplify or overcomplicate charting and don't know that #priceaction is the key to understanding it.
In this thread I share my most valuable insights I have taught myself about #charts for #trading.
In this thread I share my most valuable insights I have taught myself about #charts for #trading.

Levels are price points based on price action which act as support and resistance. When charting traditional markets I usually start on the monthly time frame and work down to the weekly and daily.
For the bitcoin charts of altcoins I usually start at the weekly down to 4-hr.
For the bitcoin charts of altcoins I usually start at the weekly down to 4-hr.

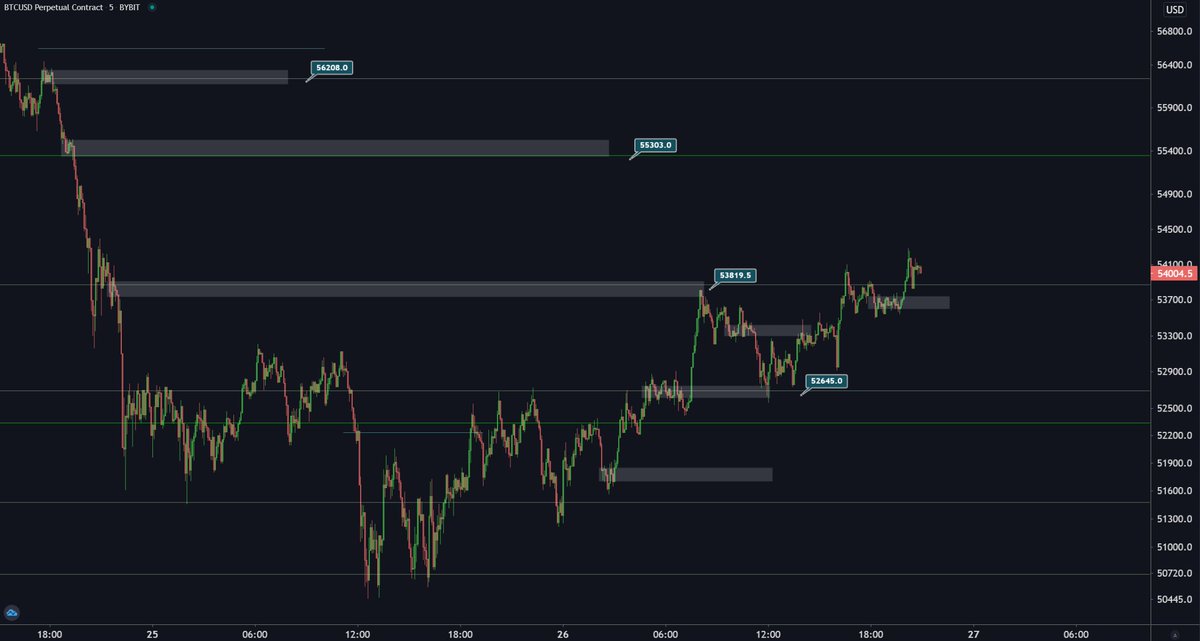
For bitcoin and other cryptocurrencies against the USD I use a different way of drawing levels. I look for points where the price bounced off in the past. When they get hit again there is a fair chance the price will react.
For swings you need less levels than for scalps.
For swings you need less levels than for scalps.

Besides levels there are certain structures of price action which are the basis of supply and demand. These structures act as support and resistance. The leading timeframes are the daily and 4-hourly.
This works great for the bitcoin pairing of altcoins.
This works great for the bitcoin pairing of altcoins.

Another way for finding supply and demand areas is marking volume nodes. A volume node is a point on the chart where the price stayed for a while before making another move.
This works great for stocks and I use this method for day trading bitcoin.
This works great for stocks and I use this method for day trading bitcoin.

In addition to volume nodes, for BTC in particular, I look at the closes of 4-hour candles at tops and bottoms too. Often the price bounces off these points. 

I don't use 'patterns' but there is one type of price structure that regularly shows up that I do trade.
It is the retest of the range after a liquidity grap/ stop-loss hunt.
I call it a 'second chance' in case you didn't enter in the 'fake out' or your stop got hit.
It is the retest of the range after a liquidity grap/ stop-loss hunt.
I call it a 'second chance' in case you didn't enter in the 'fake out' or your stop got hit.

Once you have found an entry you should always look where to put your stop-loss FIRST.
Protecting your capital is the most important part of trading.
You place your stop-loss at a point where your plan is invalidated, usually when a trend breaks.
Protecting your capital is the most important part of trading.
You place your stop-loss at a point where your plan is invalidated, usually when a trend breaks.

The single most important part of trading is managing your risk!!! You can't successfully make profits without knowing how to properly lose.
If you disagree you are just gambling.
Limited losses, maximum profits!
Save this!!!
If you disagree you are just gambling.
Limited losses, maximum profits!
Save this!!!

To make risk management easier I have made this sheet. You fill in your trade and risk tolerance and it calculates the position size in currency and in units of the asset, profit and loss and risk/reward ratio.
Use it for every trade!
Download link: docs.google.com/spreadsheets/d…
Use it for every trade!
Download link: docs.google.com/spreadsheets/d…

Instead of learning how to do TA properly clueless and/ or stubborn traders just use whatever they see first on the internet or are able to comprehend.
Unfortunately most of that is crap.
Trend lines for example. They can't be used for trading 'cause they only work in hindsight.
Unfortunately most of that is crap.
Trend lines for example. They can't be used for trading 'cause they only work in hindsight.

Patterns too have little to do with what's actually going on. Common movements have been given names in order to make them easier to explain but by doing so the underlying PA is overlooked.
The price doesn't do something because of a pattern but 'cause of support and resistance.
The price doesn't do something because of a pattern but 'cause of support and resistance.

Trading based on moving averages doesn't work either, even though it sometimes seems to. Prices only react off previous price action and sometimes an average happens to be at such a point.
Again an oversimplification of the chart.
Again an oversimplification of the chart.

• • •
Missing some Tweet in this thread? You can try to
force a refresh


