Saskatchewan #COVID19 wastewater data released today for 4 #SK communities.
Both Saskatoon & Regina showing significant INCREASES in viral load week over week. Discouraging.
Reasons for increase unclear at this time. BA.2 driven?
Brief 🧵 to review #SK wastewater data. /1
Both Saskatoon & Regina showing significant INCREASES in viral load week over week. Discouraging.
Reasons for increase unclear at this time. BA.2 driven?
Brief 🧵 to review #SK wastewater data. /1
Let's start with Regina.
@UofRegina wastewater analysis shows rebounding viral load levels week-over-week, suggestive of ongoing high rates of viral transmission in community.
BA.1 remains dominant but 18% BA.2 reported too. We expect BA.2 to dominate in coming days. /2
@UofRegina wastewater analysis shows rebounding viral load levels week-over-week, suggestive of ongoing high rates of viral transmission in community.
BA.1 remains dominant but 18% BA.2 reported too. We expect BA.2 to dominate in coming days. /2

Also, note that @UofRegina plot is time-lagged by 13 days, as the most recent analysis comes from the time period b/w Feb 6-12 inclusive.
So presumably proportion of BA.2 in Regina is higher now, just don't know how much higher. /3
So presumably proportion of BA.2 in Regina is higher now, just don't know how much higher. /3
Not much better in Saskatoon. @usask_water analysis for week ending Feb 16 shows 98.1% INCREASE in viral load burden compared to week prior.
No breakdown of proportion of BA.1 vs BA.2 included that I could find. "All Omicron". /4
No breakdown of proportion of BA.1 vs BA.2 included that I could find. "All Omicron". /4

Levels of wastewater viral load in Saskatoon are now the HIGHEST they have ever been throughout the course of the pandemic.
In summary, NO clear signal that Omicron has peaked in either Saskatoon or Regina.
I am guessing that BA.2 is driving more transmission, but not sure. /5
In summary, NO clear signal that Omicron has peaked in either Saskatoon or Regina.
I am guessing that BA.2 is driving more transmission, but not sure. /5

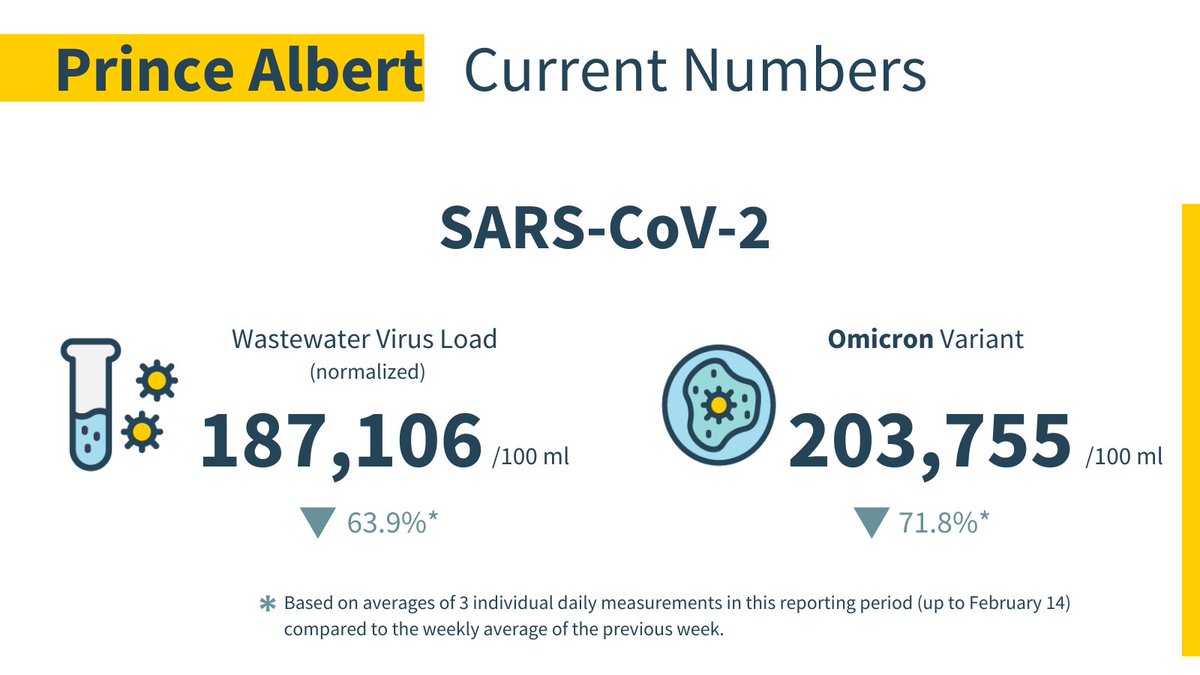
Things are different in 'rural' Saskatchewan. Prince Albert shows week-over-week DECREASE of nearly 64%. That's good.
However, rural #SK has lagged the major cities w/ Omicron, so guessing that BA.2 hasn't quite 'arrived' in smaller Saskatchewan cities quite yet. /6
However, rural #SK has lagged the major cities w/ Omicron, so guessing that BA.2 hasn't quite 'arrived' in smaller Saskatchewan cities quite yet. /6

You can see the significant decrease in viral load burden in Prince Albert week over week. We'll see whether BA.2 plays a potential role in increasing viral load burdens in the coming days. /7 

However, what's unclear is that only 77% of viral load burden is being driven by Omicron. Delta is now "undetectable".
What's the remaining 23%? Is this potentially BA.2?
Would depend on the gene targets used for sequencing, but would be helpful to get clarification. /8
What's the remaining 23%? Is this potentially BA.2?
Would depend on the gene targets used for sequencing, but would be helpful to get clarification. /8

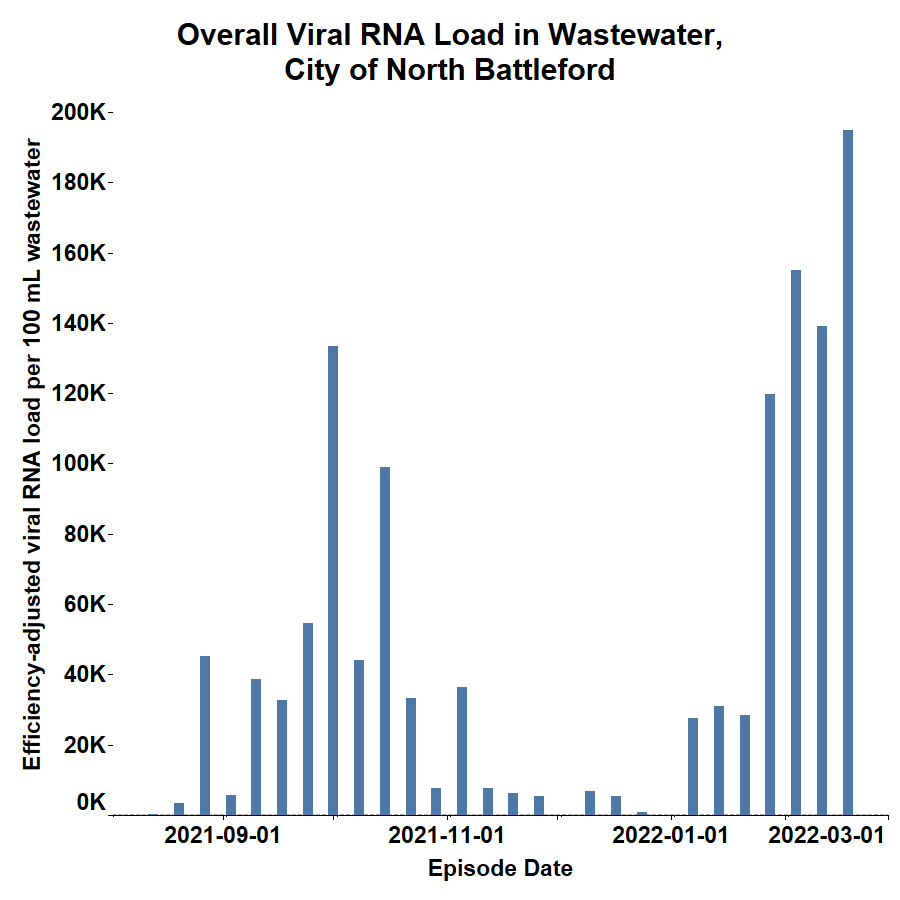
North Battleford's week-over-week virall load burden is also increasing, up nearly 40%. This represents the highest viral load burden North Battleford has ever seen, and ~86% is Omicron. Delta undetectable. Is remaining 14% BA.2? /9 


Summary:
- Omicron continues to surge across ALL of Saskatchewan
- Removal of protections (e.g. indoor masking) will prolong Omicron wave in Saskatchewan
- BA.2 will dominate in #SK 'soon'
- With no publicly available data, impossible to know where we're at
Be safe, all.
/end
- Omicron continues to surge across ALL of Saskatchewan
- Removal of protections (e.g. indoor masking) will prolong Omicron wave in Saskatchewan
- BA.2 will dominate in #SK 'soon'
- With no publicly available data, impossible to know where we're at
Be safe, all.
/end
FYI: links to source data for reference.
University of Regina data: facebook.com/UniversityofRe…
University of Saskatchewan data:
water.usask.ca/covid-19/index…
University of Regina data: facebook.com/UniversityofRe…
University of Saskatchewan data:
water.usask.ca/covid-19/index…
• • •
Missing some Tweet in this thread? You can try to
force a refresh


