Many people want to jump in to trading. Post 2021 was one kind of a market where #BuyTheDip was the basic theme of the market. That for sure is not working now when markets are tanking.
That is why in absolute basic, "Understanding Price Action" is must for traders. A Thread...
That is why in absolute basic, "Understanding Price Action" is must for traders. A Thread...
Price Action Trading is representation of Price in the forms of charts taking in values - Open, High, Low, Close referred to as OHLC Values in Candle or Bar Form. To gauge whether the price is going up or down, we plot the price wrt to time on x--y axis. For eg. #Reliance + 

This chart tells you what the market is doing and not what you think it should do. Second, you need to understand the time frame on which you are trading. For the simplicity, I will refer to 1 day charts. But traders use charts from 1minute, 5m, 15m, 30m, 1 hour to 4hr...+
It is important to understand the significance of timeframe. 5 minute to 30 minute is for intraday trading. Anything above can be for 3 -4 days trading. Daily charts are used for swing trading. It is important to set you time frame correctly. You cannot expect to make profit...+
of 4 hour time frame trading the 15 minute time frame. So set your trading time frame early based on your expectations from trading. 1. Charts 2. Time Frame.
Next you need to understand the concept of Support and Resistance.
Next you need to understand the concept of Support and Resistance.
Support – A horizontal area on your chart where you can expect buyers to push the price higher.
Resistance – A horizontal area on your chart where you can expect sellers to push the price lower.
Consider this image of #TATAMOTORS. How price jumped or fell from same price level?
Resistance – A horizontal area on your chart where you can expect sellers to push the price lower.
Consider this image of #TATAMOTORS. How price jumped or fell from same price level?
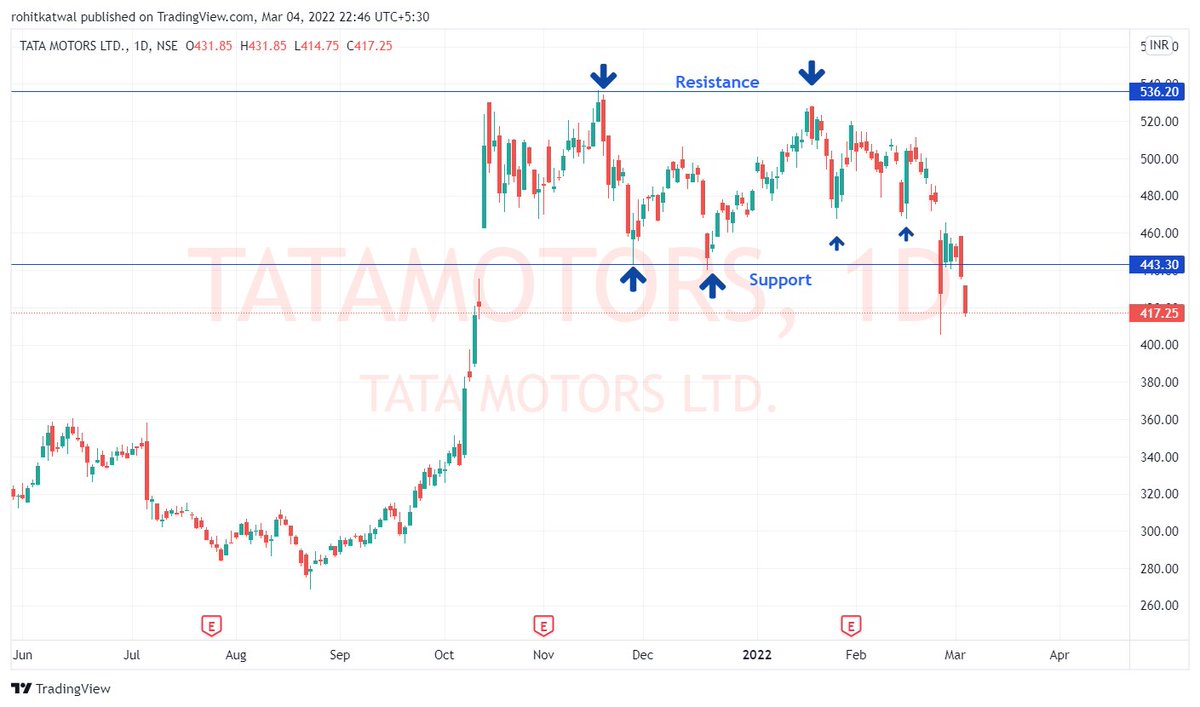
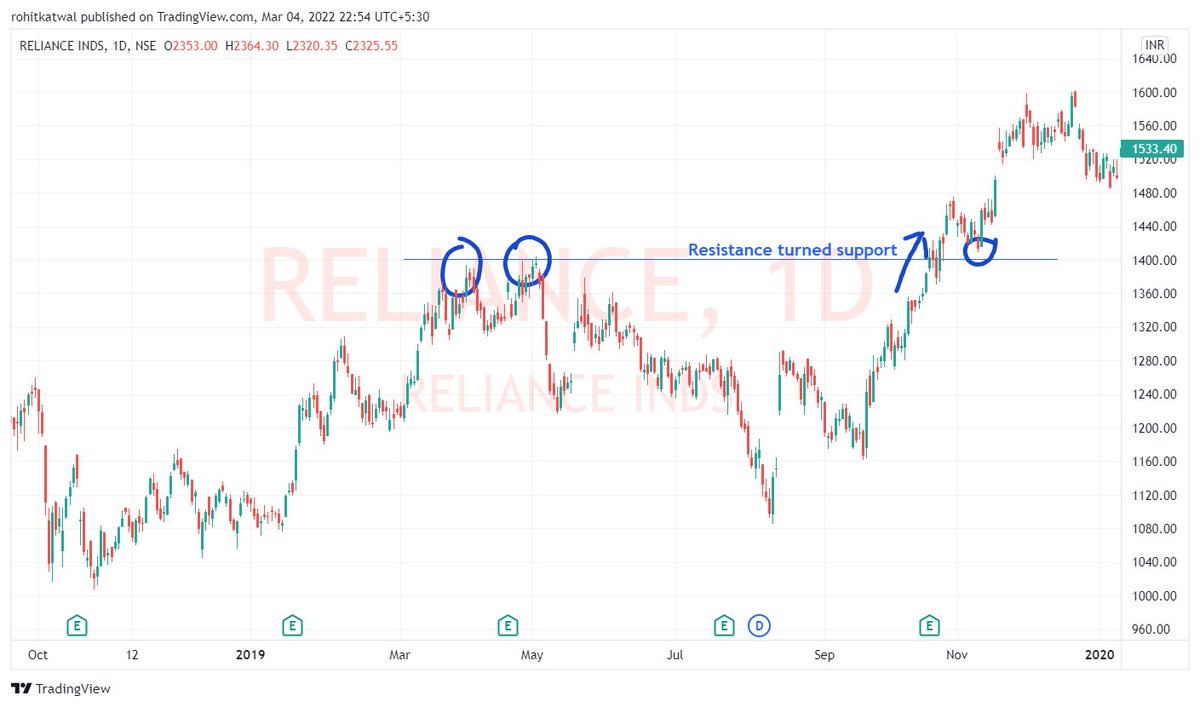
Once a support is broken, price falls below it and previous support becomes a new resistance for price. Once a resistance is broken, price rises above it and previous resistance now becomes support.
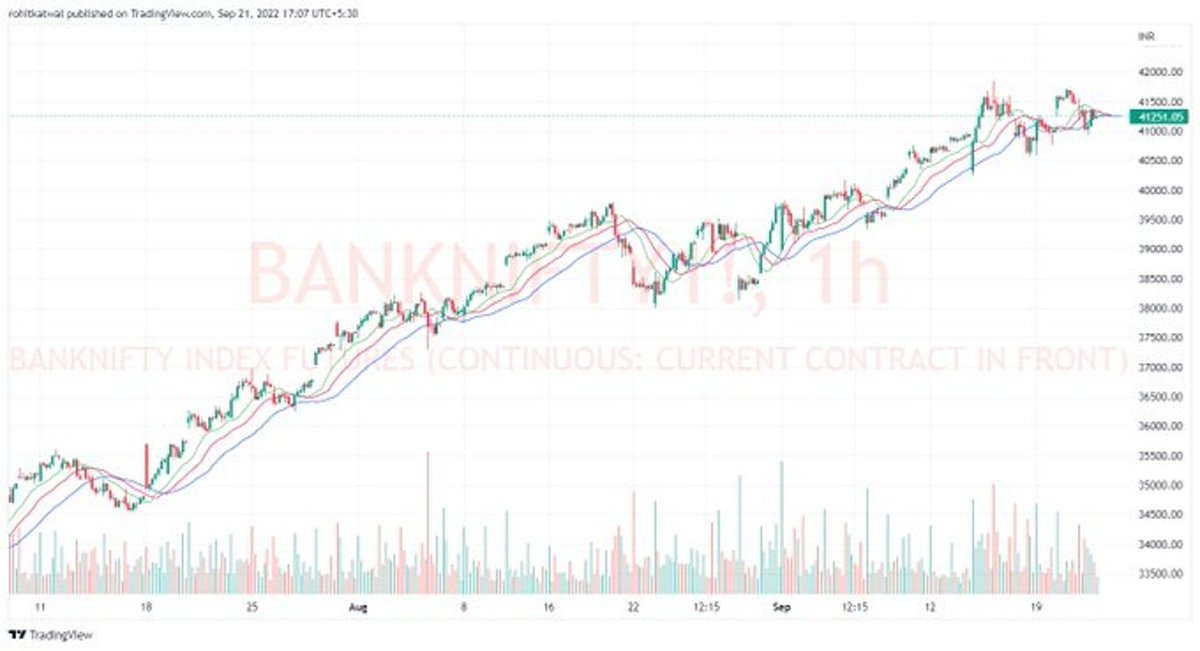
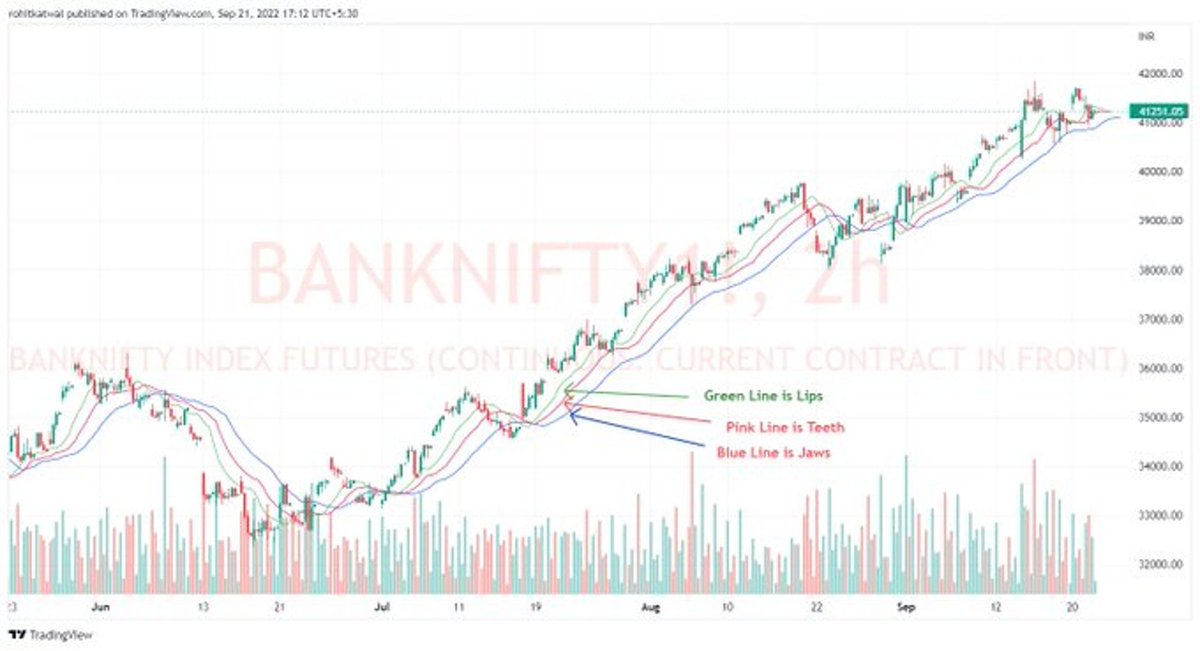
Consider these two charts for perfect example.
Consider these two charts for perfect example.

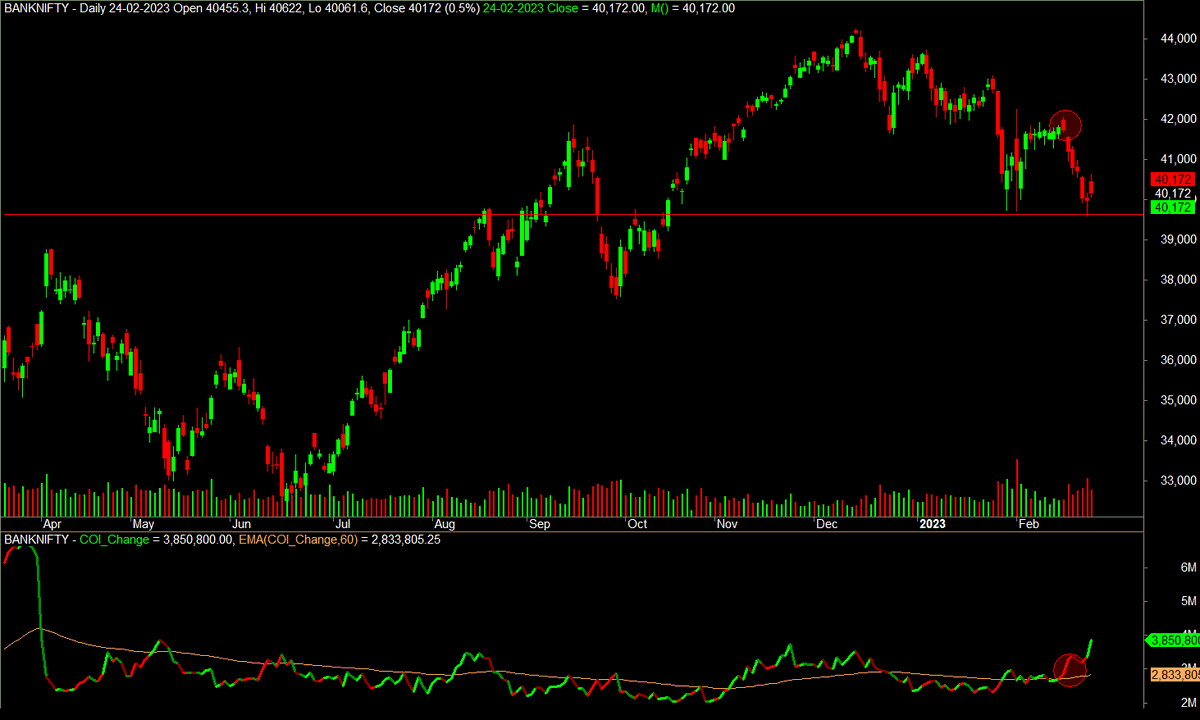
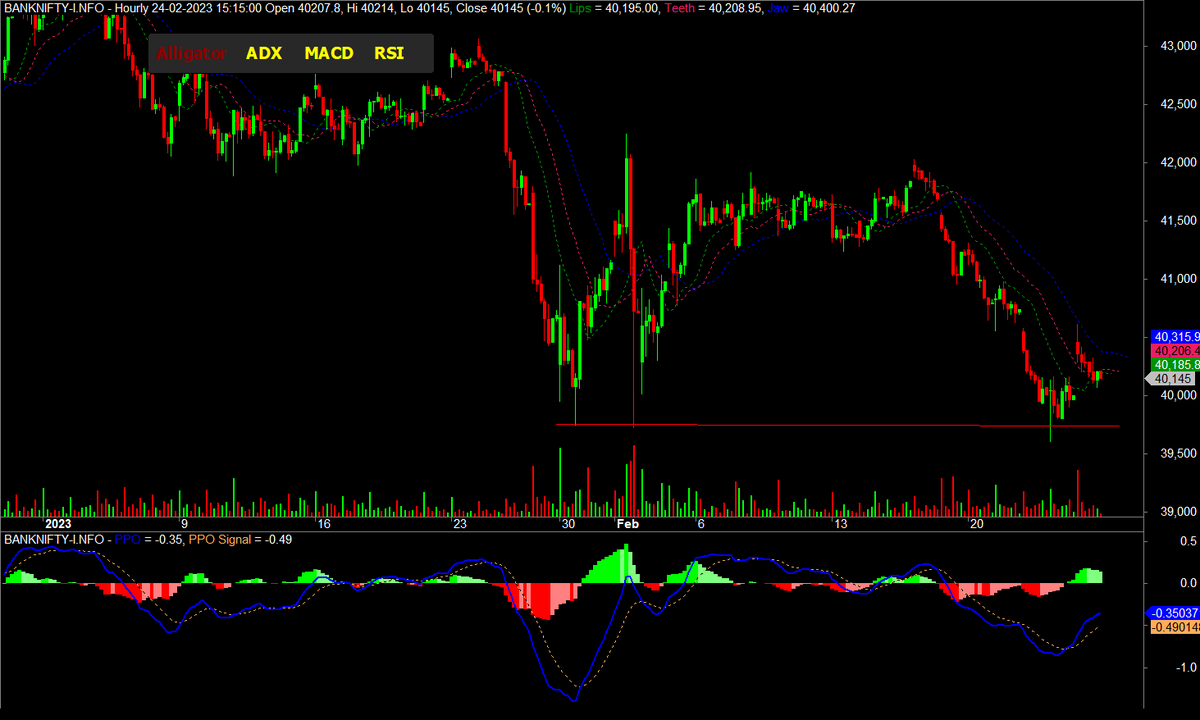
How do you define Support and Resistance on your charts?
Chart must have 200 bar on your selected time frames.
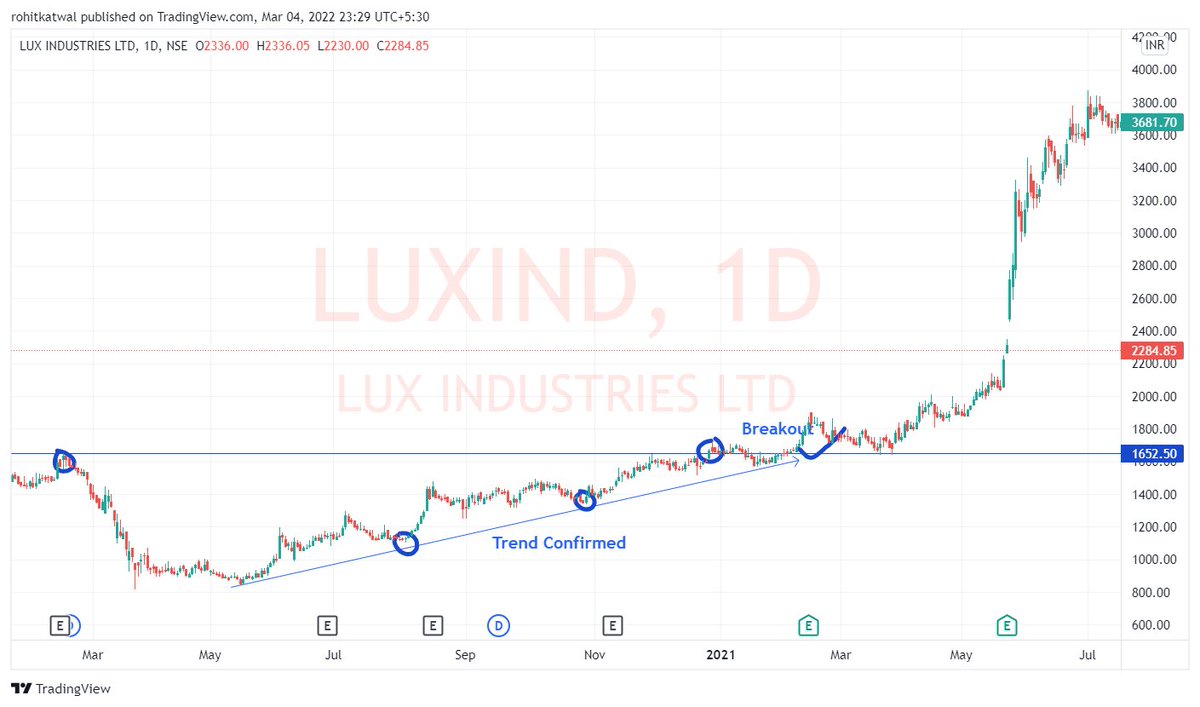
Look for price on charts where price has Risen/Fallen atleast 2 times. Mark a horizontal line at such places. These are your Support and Resistance Points. Consider eg.
Chart must have 200 bar on your selected time frames.
Look for price on charts where price has Risen/Fallen atleast 2 times. Mark a horizontal line at such places. These are your Support and Resistance Points. Consider eg.

Why is Support and Resistance important? Because price goes up when breaks a resistance. Price goes down when breaks a support. If after breaking a resistance, price falls below resistance or after breaking support price rises above support, its called fake breakout.

This is classic Support and Resistance I like to use. You can look into Dynamic Support or Resistance based on EMA/MA also. Various moving averages like 20/50/100/200 can be used. Consider example of LTFH and #ESCORTS on 50 Moving Average.
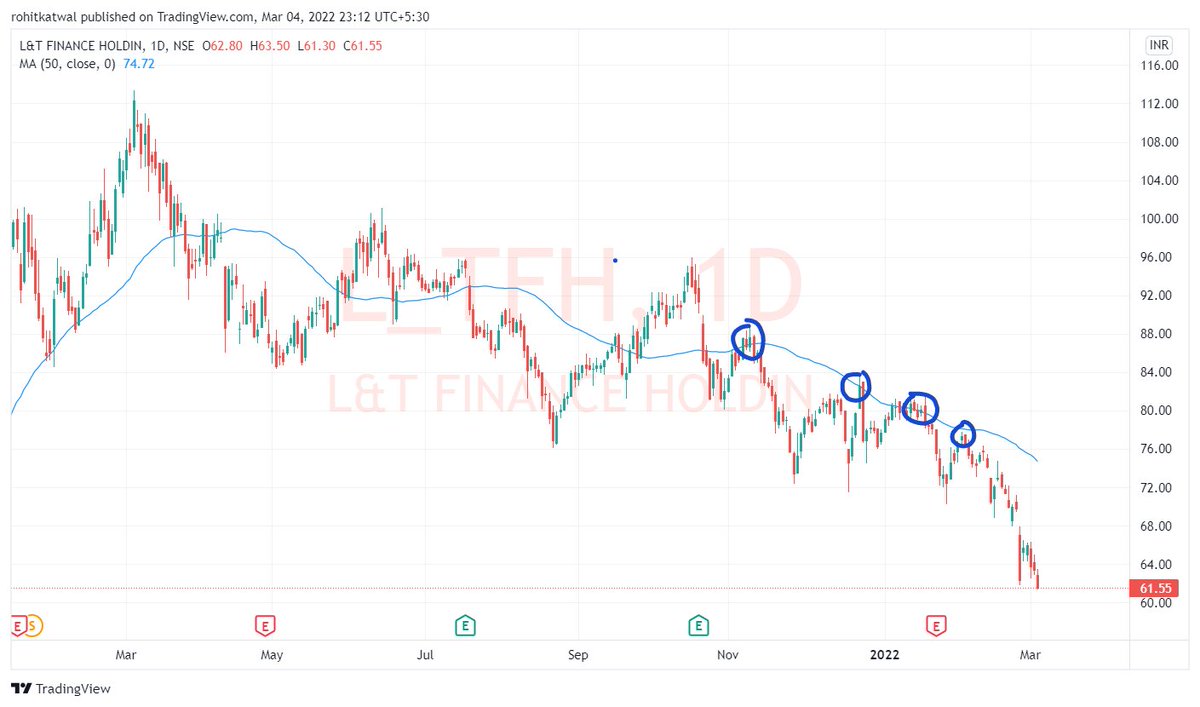

As you can see, Support and Resistance can be used to trade breakouts or reversals. It needs practice and money management on the part of a trader which we will cover in a separate thread.
Now market moves in 4 phase:
1. Accumulating
2. Trending
3. Distribution
4. Declining
+
Now market moves in 4 phase:
1. Accumulating
2. Trending
3. Distribution
4. Declining
+
As a trader, in your time frame, its your job to find these phases and trade accordingly. Consider example of #LALPATHLABS for example. Before #COVID19 there was accumulation. Followed by a breakout because of increased profit, then distribution and finally decline.

As a trader, you look for trending or declining phase to make profit with the help of support and resistance zones to identify accumulation and distribution zones. As a rule of thumb, you always trade in the direction of the trend. Buy in uptrend, Sell in downtrend. +
To make things easier, one can use various methods to trade in the direction of the trend. My favorite method is to trade using chart patterns. Secret to using chart patterns for profitable trading is - "Identifying the chart pattern in the direction of the bigger trend". +
Sharing example of some of my favorite chart patterns. You can google these for more information.
VCP (Volatility Contraction Patter) or Cup and Handle
It is important to trade chart patterns in the direction of the trend with proper Risk Management.
VCP (Volatility Contraction Patter) or Cup and Handle
It is important to trade chart patterns in the direction of the trend with proper Risk Management.
Other Trend Continuation patterns that a trader can look for is:
1. Ascending Triangle
2. Inverted Head and Shoulder
3. Pennants
4. Bullish Flags
5. Darvas Box etc.
Even mastery of a single pattern is enough for a trader to make a living out of it.
1. Ascending Triangle
2. Inverted Head and Shoulder
3. Pennants
4. Bullish Flags
5. Darvas Box etc.
Even mastery of a single pattern is enough for a trader to make a living out of it.
Other important concepts in price action that a new trader must look into is:
1. Multiple time frame trading
2. Candle Stick patterns
3. Trading Reversals
and few more like Fibonacci Levels etc. I think this is enough for a new trader to start. Best of Luck.
1. Multiple time frame trading
2. Candle Stick patterns
3. Trading Reversals
and few more like Fibonacci Levels etc. I think this is enough for a new trader to start. Best of Luck.
• • •
Missing some Tweet in this thread? You can try to
force a refresh