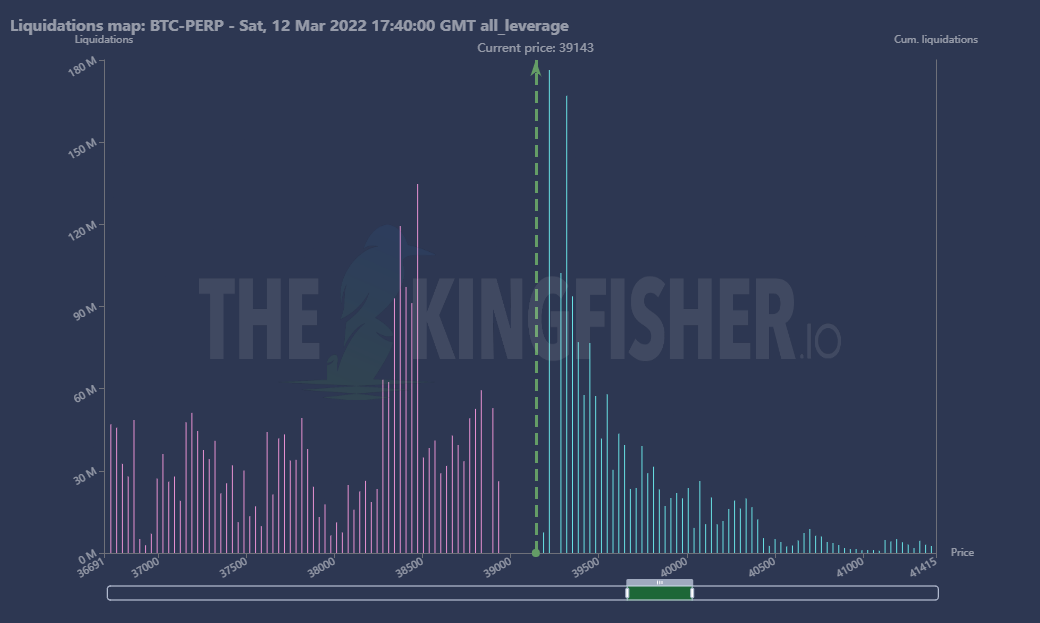
🚨Little update: Many longs just closed or liquidated, open interests declined, leverage ratio declined, funding rate dumped hard, but is almost neutral, we have CPI data release (volatility will rise!!) in almost 4 hours, big shorts liquidation cluster at 42k and
long liquidation cluster at 38.4k! Since we have reached our "local bottom" we can't detect any big flows, neither stablecoins nor #BTC spot. Whales ratio hourly maintains high level indicating sell pressure by whales.
Gamma dumped too. I would expect a pump and dump today again. Have closed my short already and will sit on my hands now until I see a solid trend.
Cipher is the only indicator I use sometimes just as last confirmation step. The indicator is imo the best you can get for free on tradingview. However, its pump and dump signals are very accurate, I would say 80% of times it was right. Checking the data, it looks today more
bullish than yesterday. Even then I wouldnt say its a solid trend, but then Cipher generated a huge pump signal. Because the last time we received such a pump signal was end of december and it was a high volatile period. Something I would also expect today. So, be careful and
adjust your risk management please! ❤️🙏
• • •
Missing some Tweet in this thread? You can try to
force a refresh
Whales ratio not indicating a pump atm, funding rates lifting up but still negative, while a rising leverage ratio and open interest indicating more high leverage longs coming in, liquidation map showing almost $440m volume on shorts at 39.2k - 39.3k and more
volume at 38.8k the way down for long liquidations. Flows looking relatively flat atm. Just $80m stablecoin inflow detected to spot exchanges. Option traders in the last 2 days not showing big trades. For march looks bearish to me. They are expecting a bearish price action it
seems. Maybe related to the incoming (14MAR22) vote for a potential ban of POW in Europe.
I will short with a max leverage of x10 and SL in case they will surprise me with a pump. At the moment I can't detect anythink that would let us predict a pump soon
OUr block view shows what happenend before our recent dump. Whales stopped to send tokens to exchanges and let the price lift up heading 38.7k where again, they met low demand. Even if #BTC is and was following
$SPX, its reaction wasn't driven by $SPX. Our whales ratio 30block average is rising again. But without big netflows. I just have detected one big inflow today and that was #Gemini and 1,000 #BTC.
Our hourly view is showing here imo the preparation of the incoming downward
trend. The whales ratio is more becoming a dump prepration indicator at least in the daily and hourly view. The whales ratio doesn't show its effect immediately afterwards, instead more preparations. Whales sent tokens days before and wait for the opportunity to dump as soon they
Bitcoin Market Update [01Feb22]
FREE VERSION
Block View
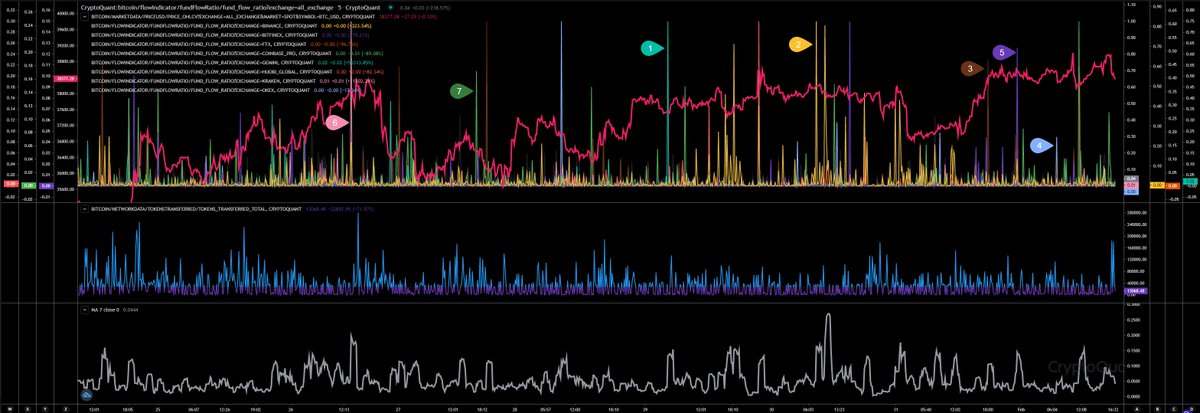
The whales ratio (1) has started to rise again since this morning, but is declining again. Also confirmed by our whales ratio 30block average (2). Outr total netflows shows a gain a bit more negative netflow (3) indicating
more outflows than inflows.
Interesting here. The stablecoin reserves (2 - yellow curve) on exchanges is on a high level with $25.6 billion, even if we have detected big outflows from exchanges in the last few days.
Because of my delayed analysis today, I would like to share a paid sub analysis of yesterday with all of you. Paid subs will received something else instead soon. To make clear, the report is from yesterday!
As mentioned today in my daily analysis I have detected some interesting patterns related to the Whales Ratio 30D Average.
What does it mean? The whales ratio only indicates whether whales send BTC to exchanges, not how much. However, zooming out it shows you very clear
distribution preparations. Keep in mind, that we are using a 30 Days Average here.
Whales prepare their distribution sending their tokens to exchanges when nobody is expecting that. While we are still lifting up in price, everyone is expecting the next ATH and FOMOying, while
Block View
The whales ratio (1) in block view was indicating an incoming lift up (pump) by dumping itself showing less BTC sent by whales. Since then the whales ratio is rising again.
Also our whales ratio 30block average (2) is confirming that move. However, it maintains now its high level. We need to see what happens in the next few hours. If it keeps falling that would indicate less pressure and would allow BTC to lift up in price even more.
As you can see, we had some big netflow activity (3) indicating here incoming big inflows. Today the netflow chart shows more positive netflows than negative ones, also indicating more tokens arriving on exchanges.
🚨🚨 Bitcoin Quick Market Update
Hourly View
Our hourly looks good at the moment. Whales ratio is declining, price action rising. Netflows showing bigger outflows. Yesterday we had a lot of inflows and a big sell pressure.
We need to see what happens next and if the whales ratio keeps falling. Then I would expect 38k first. If the inflows keeps declining too, I would expect a retrace back to 38k first.
Block View
Our block view also indicating more a bullish trend now. That’s a short-term view.
That can flip quick, but at the moment it looks good to me, to see 38k soon. Of course it depends also on the buy pressure. If they want to accumulate at 35k, we will maintain this price level a while. However, at the moment it doesn’t look that bearish. But we need to check all