…including a brand-new *state-level* COVID death rate analysis which shouldn’t surprise anyone:
acasignups.net/22/03/14/time-…
My findings are similar to those of @DougHaddix. While I usually focus on county-level data, it’s the same story (if not more so) at the state level:
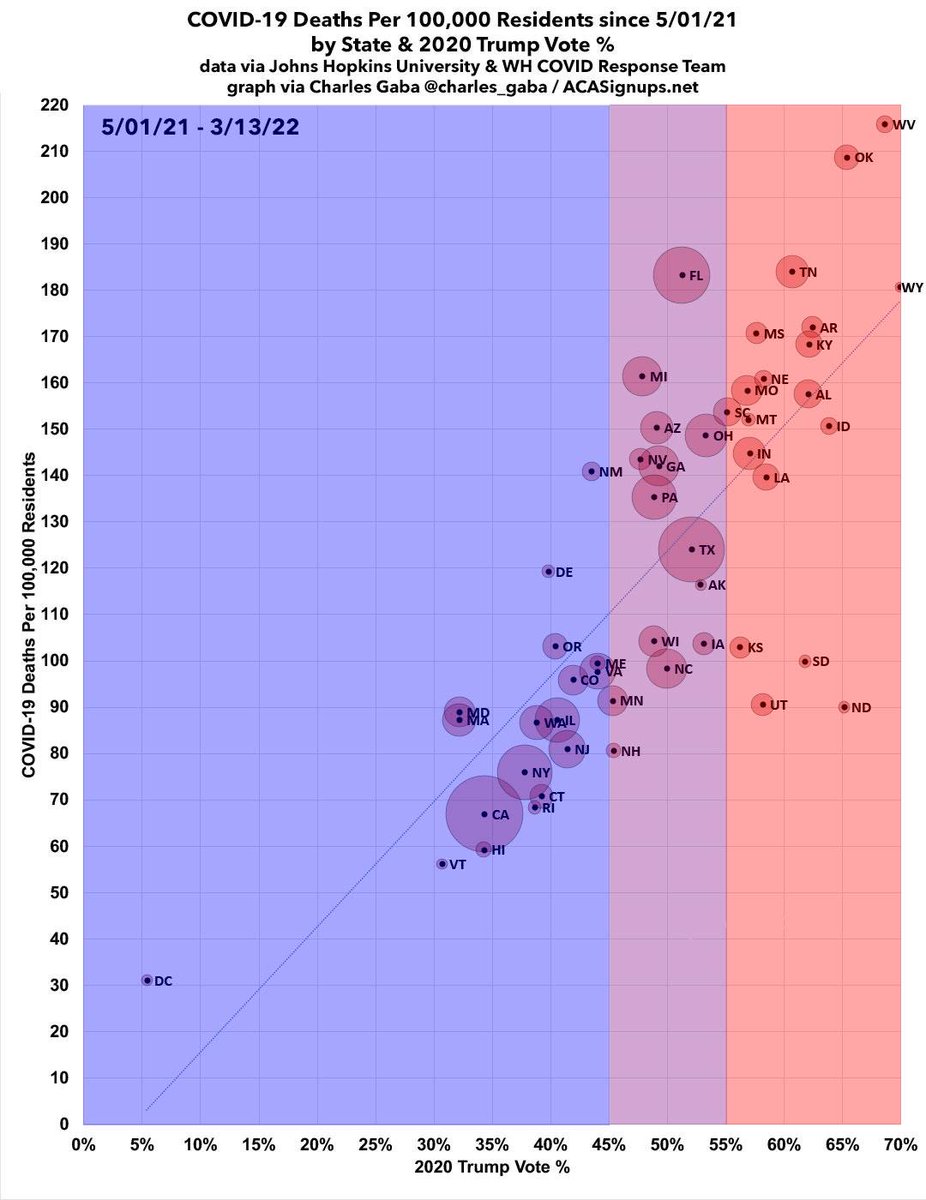
.@Milbank focuses on Florida. It might seem reasonable to assume that FL’s high death rate is due to them having a lot of seniors, but as @greg_travis and I noted last fall, that’s not nearly as big as a factor anymore for many reasons… acasignups.net/21/10/06/rumor…
…and furthermore, MAINE has both an older median age *and* a higher percent of seniors than Florida, yet their death rate since last spring ranks either 32nd or 36th depending on your starting date. Yet Florida’s rate is over 80% higher since then.

• • •

Missing some Tweet in this thread? You can try to force a refresh
 

Keep Current with Charles Gaba 🇺🇦

Charles Gaba 🇺🇦 Profile picture

Stay in touch and get notified when new unrolls are available from this author!

Read all threads

This Thread may be Removed Anytime!

PDF

Twitter may remove this content at anytime! Save it as PDF for later use!

Try unrolling a thread yourself!

how to unroll video
  1. Follow @ThreadReaderApp to mention us!

  2. From a Twitter thread mention us with a keyword "unroll"
@threadreaderapp unroll

Practice here first or read more on our help page!

More from @charles_gaba

Mar 16
Of all the graphs & charts I've done over the past couple of years, this one includes the single eeriest coincidental data point. Image
(By “coincidental” I don’t mean the overall pattern, I mean the fact that the crossover happened on that EXACT date as opposed to a week or two earlier or later.)
The crossover date does shift around a bit if you use the reddest/bluest 20% or 30%, but at 10%, which is what I’ve been using in a lot of my work, it’s right on the nose.
Read 7 tweets
Mar 13
Many people have asked me why the Biden Admin didn’t move on this LAST year. There’s two reasons I can think of: First, the process is a long & convoluted one; it might simply have taken a full year to get to this point. 1/
The other is more pragmatic: They were hoping to have #BuildBackBetter passed and signed into law by now. The CBO score *without* the family glitch will likely be billions of dollars higher than with it still in place. They might’ve been hoping to lock in ARP legislatively first.
With the #FamilyGlitch fixed, up to 5.1 million more Americans would become eligible for #ACA subsidies. Assuming half of them took this up, that’d increase enrollment by another ~18% or so. CBO scored permanent ARP subsidies at ~$220B over a decade, so that’d go up ~$40B or so.
Read 5 tweets
Mar 12
Reminder: Another ~1,600 Americans were reported to have died of COVID yesterday.
Most of these deaths are of people who got infected 3-4 weeks ago. The daily death numbers should start dropping in another week or so. But still.
Meanwhile, here’s the death rates in the U.S. since all adults became eligible to get vaccinated.
Read 4 tweets
Mar 11
📣 On anniversary of the #ARP, Biden-Harris Admin highlights health insurance subsidies that promoted critical increases in enrollment & savings:
acasignups.net/22/03/11/durin…
📣 REMINDER: Thanks to the enhanced financial subsidies, increased outreach, expanded assister resources and the elimination of the dreaded #SubsidyCliff, a record-breaking *15.5 MILLION* Americans enrolled in TRULY affordable #ACA coverage for 2022. Image
📣 #ACA enrollment increased by 21% y/y nationally. It's up across 47 states, with 16 states seeing enrollment increase by 25% or more, and some going up by as much as a whopping 42%!

Millions of #ACA enrollees are saving an average of $800 apiece this year thanks to the #ARP.
Read 4 tweets
Mar 11
This appears to be garbage.

The average American drove 14,263 miles/yr in 2019. Let's call it 15K/yr even. 1/
kbb.com/car-advice/ave….
~15K miles x ~331M people = ~5 trillion miles/yr driven nationally.

My Kia Niro EV, which is pretty typical of 2022 EVs I believe, gets ~250 miles/charge on a 64 kWH battery.

5T miles / 250 = ~20 billion full charges.

20B x 64 kWH = ~1.3 trillion kWH, or ~1.3B MWh per year. 2/
via the U.S. EIA, the *smallest* nuclear power plant in the U.S. produced 4,727,764 MWh in 2021.

It would take around 275 *small* nuclear power plants to produce enough electricity to power every EV assuming all 331M Americans used them. 3/
eia.gov/tools/faqs/faq…
Read 11 tweets
Mar 11
Good.

For those claiming hypocrisy since she *is* calling for the *federal* gas tax to be suspended, the difference is that states aren't allowed to run deficits. Still shouldn't suspend the federal gas tax either, though.
(and yes, I just bought an electric car, but that also means my annual registration fee is an extra $140 per year to make up for the gas tax I won't be paying)
Honestly, that seems awfully steep. MI's gas tax is $0.272/gallon. $140 would be the equivalent of using 515 gallons of gas per year. At 25 mpg, that'd mean driving 13,000 miles/year even though I only drive about *half* that.
Read 6 tweets

Did Thread Reader help you today?

Support us! We are indie developers!


This site is made by just two indie developers on a laptop doing marketing, support and development! Read more about the story.

Become a Premium Member ($3/month or $30/year) and get exclusive features!

Become Premium

Don't want to be a Premium member but still want to support us?

Make a small donation by buying us coffee ($5) or help with server cost ($10)

Donate via Paypal

Or Donate anonymously using crypto!

Ethereum

0xfe58350B80634f60Fa6Dc149a72b4DFbc17D341E copy

Bitcoin

3ATGMxNzCUFzxpMCHL5sWSt4DVtS8UqXpi copy

Thank you for your support!

Follow Us on Twitter!

:(