Business has never been better for oil and gas producers.

Here's why share prices can move even higher from here, in this Golden Age of Oil and Gas Producers 🧵
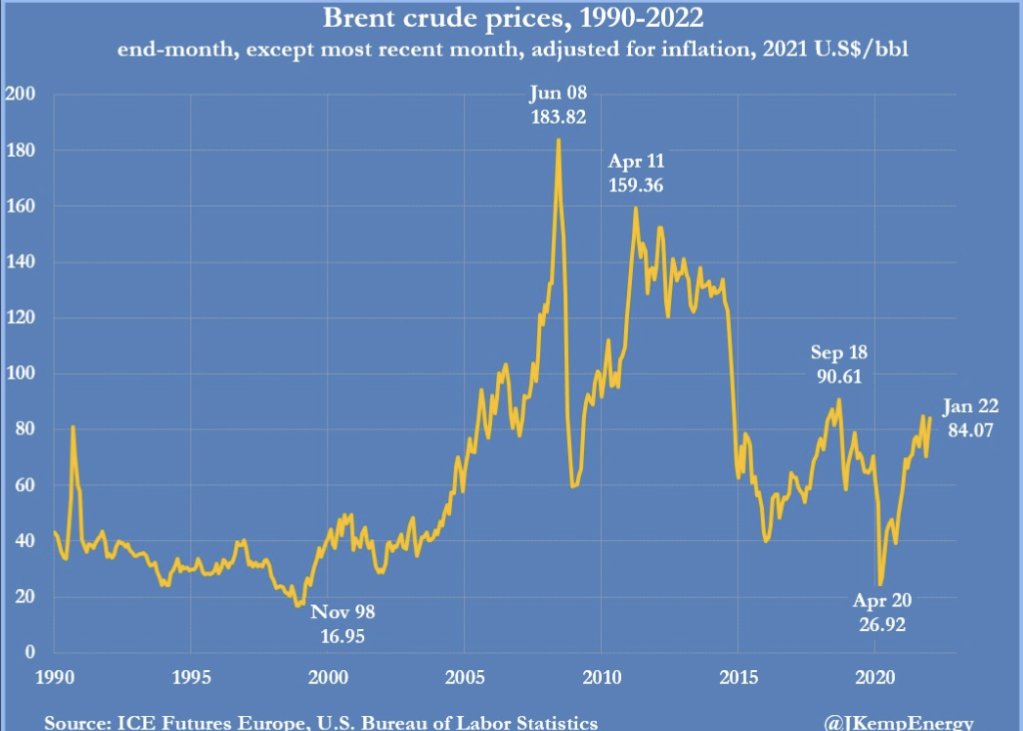
(1/13) Improving fundamentals have renewed interest in oil and gas equities, and a once left-for-dead sector is seeing share prices rising. Yet even with recent outperformance, there's room to run as oil equities catch up to Oil and the broader market:
(2/13) And while rising commodity prices have undeniably been a tailwind for E&Ps, their business models and balance sheets have improved markedly since the last cycle high. Cash flows have nearly doubled from levels achieved in 2014, a time with a similar oil price:
(3/13) Oil and gas producers are more profitable than ever. E&P management teams have "trimmed the fat" since the 2014 oil price crash, resulting in leaner cost structures, better capital deployment and higher cash flows. It is the Golden Age for Oil and Gas Producers
(4/13) With leaner cost structures, E&Ps have become more survivable in the event of another oil price downturn while generating more cash flow at higher oil and gas prices. This chart highlights the change in quarterly expenses of four indicative smaller E&Ps:
(5/13) Unlike the deluge of capital spending in the years leading up to the 2014 crash, E&Ps have been focused on minimizing expenditures to return capital to shareholders. Consequently, their capital efficiency has improved markedly, as can be seen here:
(6/13) In this new Golden Age for oil and gas producers, Canadian E&P’s shine particularly bright: a weaker Canadian dollar bolsters revenue for E&Ps selling their production in the US. Historically the CAD/USD moved in line with oil prices, but recently these have diverged:
(7/13) To illustrate these effects of a weaker CAD, and lower costs and capital expenditure for Canadian E&Ps, we modeled the change in cash flow for a hypothetical 10,000 bbl/d oil-only producer between Q4 2014 and Q4 2021, assuming $80 WCS and using real exchange rates:
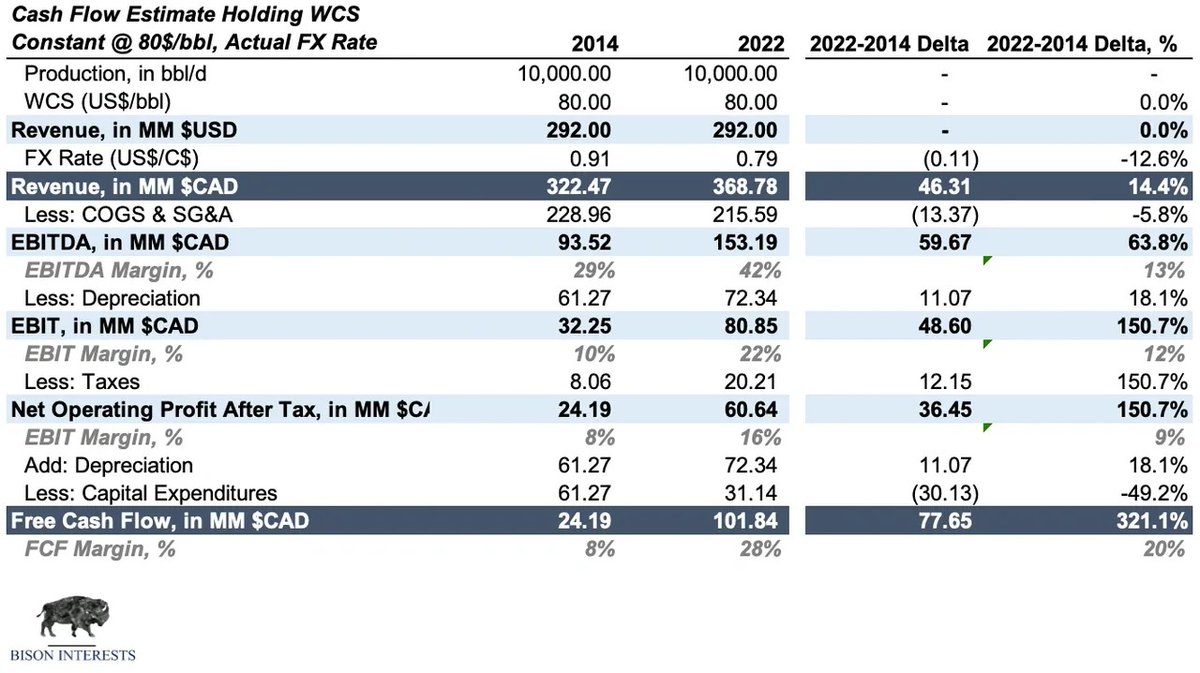
(8/13) As can be seen above, Canadian E&Ps may generate significantly higher cash flows than in 2014 due to poorly understood currency effects, structural cost reductions and lower capex. They remain exceptionally cheap and may outperform moving forward.
(9/13) However, these implications seem to be overlooked by the market. E&P EV/EBITDA multiples have compressed from 2014 and 2021, despite similar commodity pricing and higher EBITDA growth:
(10/13) Multiple compression can be explained by capital leaving the sector following 2014, and the ESG movement, which has artificially restricted the availability of capital and increased the regulatory burden to the industry. This has driven valuations near historic lows:
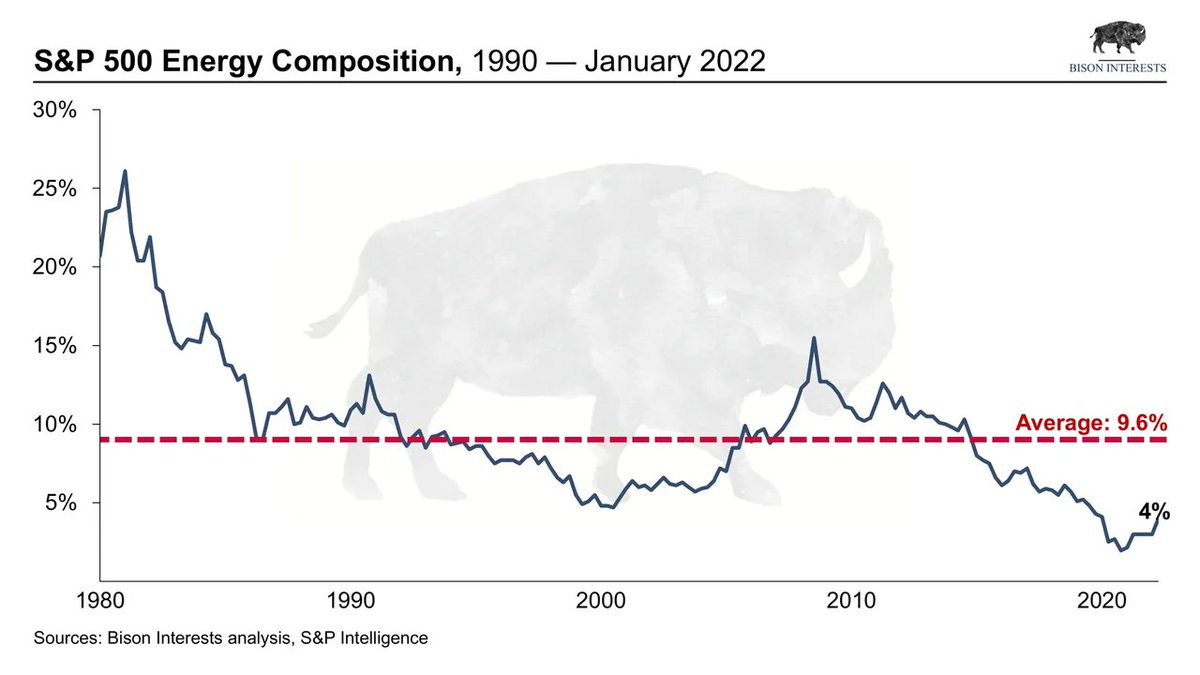
(11/13) Despite the ongoing rally in energy equities, they remain meaningfully undervalued, and there may be substantial upside even if they were only to revert to their mean composition percentage of the $spx index
(12/13) As cash flows become too costly to ignore, capital may return the industry and multiples could reflate. Even if institutional capital doesn't return, higher dividends and buybacks could drive strong returns for years to come in the Golden Age of oil and gas producers.
(13/13) To see our more detailed analysis, see the link below. Let us know what you think, and if you enjoyed this thread, please share it!
#com #eft #oott #oil #gas #golden #age
bisoninterests.com/content/f/the-…

• • •

Missing some Tweet in this thread? You can try to force a refresh
 

Keep Current with Bison Interests

Bison Interests Profile picture

Stay in touch and get notified when new unrolls are available from this author!

Read all threads

This Thread may be Removed Anytime!

PDF

Twitter may remove this content at anytime! Save it as PDF for later use!

Try unrolling a thread yourself!

how to unroll video
  1. Follow @ThreadReaderApp to mention us!

  2. From a Twitter thread mention us with a keyword "unroll"
@threadreaderapp unroll

Practice here first or read more on our help page!

More from @BisonInterests

Jan 18
DUC Dilemma & 2022 Oil Market Outlook: A Thread

Despite the run-up in energy prices over the last year, we’re likely in the early innings of an o&g bull market. Here’s why we think 2022 could be another stellar year for oil and gas equities 🧵
(1/19) #Oil prices are moderate when benchmarked against #CPI #inflation, which may be understated Image
(2/19) The macroeconomic backdrop for oil is compelling. Hostile policies directed at producers and un-economic “ESG” mandates are restricting capital, which is lowering supply, raising prices and causing a lot of pain for consumers, particularly in Europe: Image
Read 20 tweets
Dec 20, 2021
On buying the oil dip. While many are calling for the end of the oil and gas bull market, or attempting to time the market, we embrace this volatility and continue to buy discounted shares. A thread 🧵
(1/x) The recent pullback kicked off with the announcement of the novel “Omicron” variant. This started sentiment-driven, as with a lack of concrete data at the time of announcement, it was up to investors imaginations to forecast potential market impacts of spiking case counts
(2/x) A few weeks later, full lockdowns of major economies remain unlikely, as both real-world data and messaging from health officials suggest that Omicron, while far more infectious than previous mutations of the virus, is far less deadly @jpmorgan
Read 21 tweets
Dec 8, 2021
News about Kuwait struggling to raise production just hit the wire. Just in time for our OPEC+ compliance scorecard for November!
OPEC+ under-produced their quota again in November #oott #oil #opec
This is a follow up on our earlier analysis on OPEC+ spare capacity bisoninterests.com/content/f/opec…
Read 6 tweets
Nov 25, 2021
Winter is (almost) here! Time for another energy crisis thread. Record power prices, coal and natural gas shortages (and even ration cards!), what else will unfold? 🧵
And Poland has responded to surging prices by cutting energy taxes
Read 18 tweets
Oct 17, 2021
This is an ongoing thread about the global energy crisis. As the crisis unfolds, we will update here.
Today, a Financial Times @FT article reports on China's electricity crisis further disrupting the global supply chain h/t @JKempEnergy ft.com/content/5174e5…
And Switzerland warns "big" firms they may need to cut their electricity usage @chigrl bloomberg.com/news/articles/…
Read 60 tweets
Sep 21, 2021
As energy prices rise around the world, many continue to downplay the possibility of a global energy supply crisis, citing OPEC+ spare capacity available to come back online. But does OPEC+ really have as much spare capacity as advertised?

Thread below👇
Due to a lack of reliable data, many industry experts and analytics firms have adopted OPEC+’s self- reported numbers. The EIA estimates that OPEC+ has 6.9MM bbl/d of spare capacity, yet no one knows if this is accurate, and few seem to care. (1/12)
OPEC+ controls about 50% of the global oil supply, mostly from Russia and Saudi Arabia. These are known as “swing producers” because, unlike most other producers, they adjust their production in response to changing market fundamentals to balance the market. (2/12)
Read 14 tweets

Did Thread Reader help you today?

Support us! We are indie developers!


This site is made by just two indie developers on a laptop doing marketing, support and development! Read more about the story.

Become a Premium Member ($3/month or $30/year) and get exclusive features!

Become Premium

Don't want to be a Premium member but still want to support us?

Make a small donation by buying us coffee ($5) or help with server cost ($10)

Donate via Paypal

Or Donate anonymously using crypto!

Ethereum

0xfe58350B80634f60Fa6Dc149a72b4DFbc17D341E copy

Bitcoin

3ATGMxNzCUFzxpMCHL5sWSt4DVtS8UqXpi copy

Thank you for your support!

Follow Us on Twitter!

:(