TAnalyst Profile picture
Apr 27 5 tweets 4 min read
1/ #BITCOIN AND #SP500

THE NEXT MONTHS WILL BE BULLISH.

HERE'S WHY. 👇

#CRYPTO #BTC #SPX
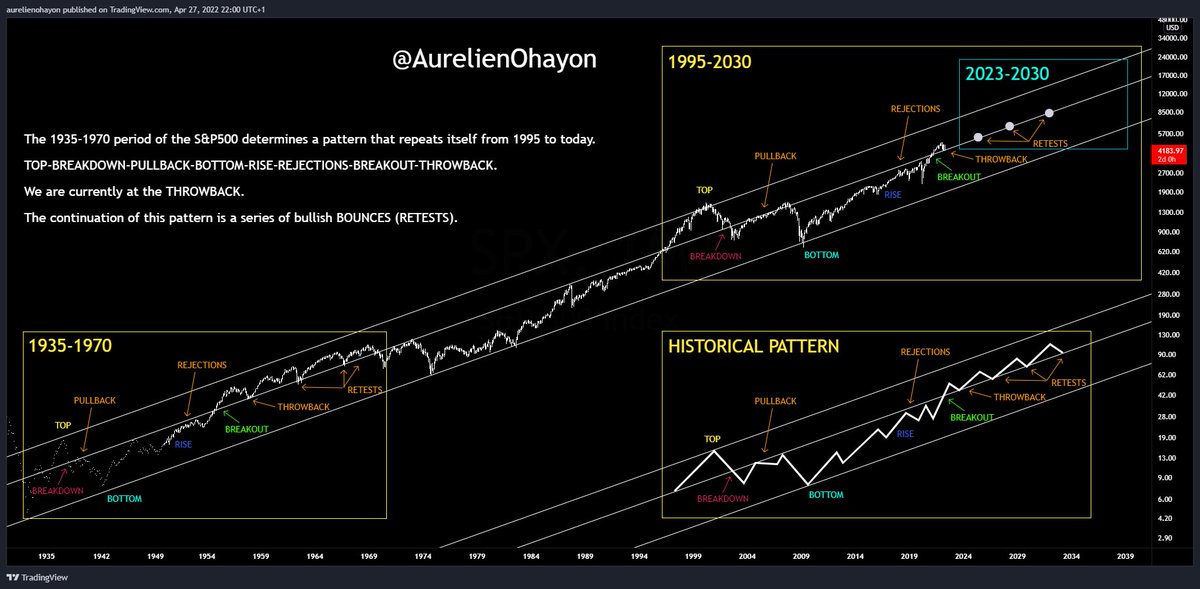
2/ THE 1935-1970 PERIOD OF THE #SP500 DETERMINES A PATTERN THAT REPEATS ITSELF FROM 1995 TO TODAY.

TOP-BREAKDOWN-PULLBACK-BOTTOM-RISE-REJECTIONS-BREAKOUT-THROWBACK.

WE ARE CURRENTLY AT THE THROWBACK.

THE CONTINUATION OF THIS PATTERN IS A SERIES OF BULLISH BOUNCES (RETESTS).
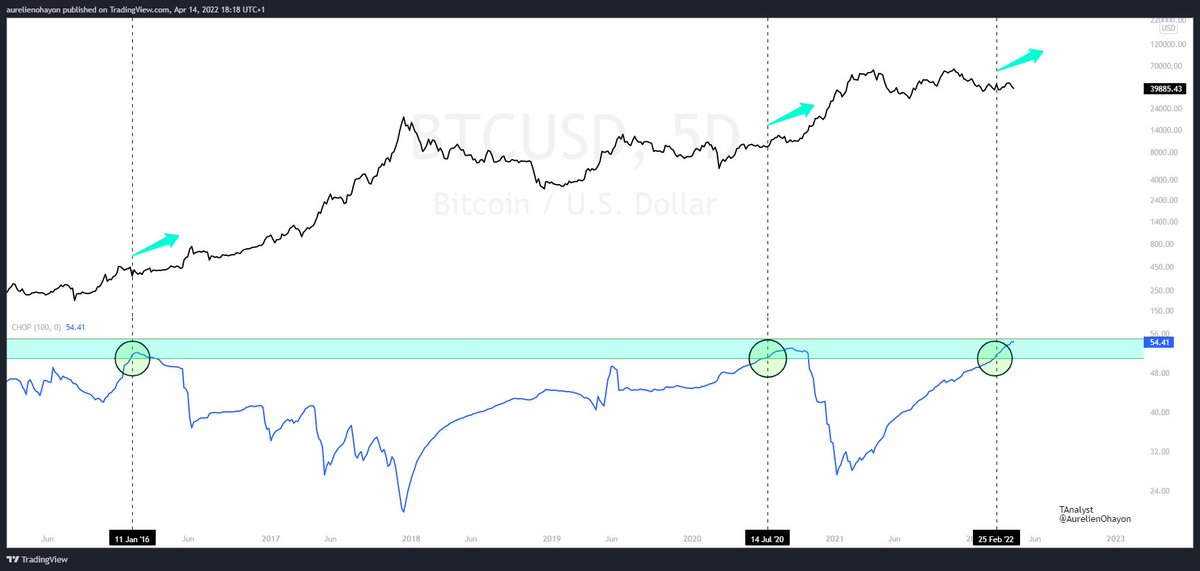
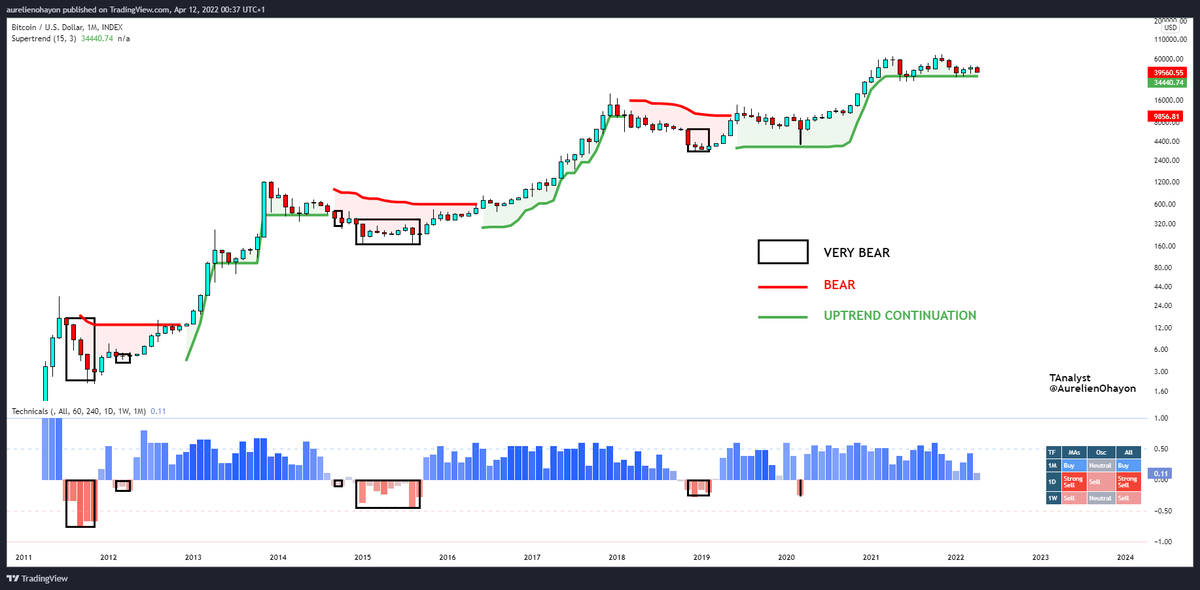
3/ MANY OF THE #SP500 INDICATORS HELP DETERMINE HISTORICAL #BTC BOTTOMS. (SEE FOLLOWING ANALYSIS)

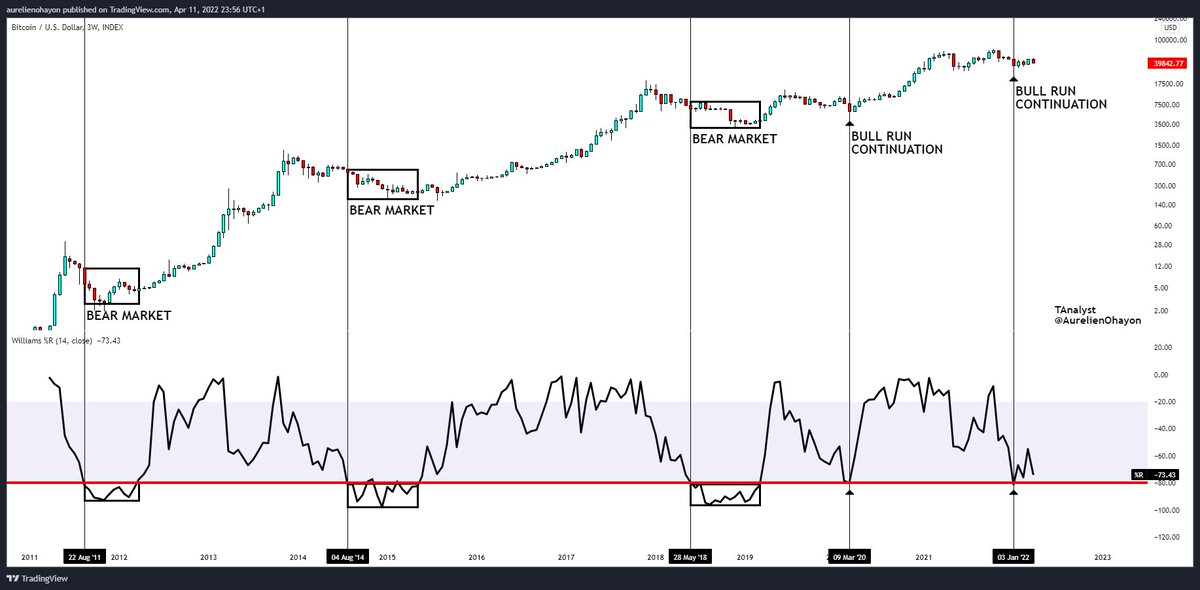
NOW AS THE PREVIOUS ANALYSIS SHOWS, #SPX WILL PROBABLY BE BULLISH IN THE NEXT MONTHS.

BITCOIN WILL THEREFORE FOLLOW THIS MOMENTUM AND WILL ALSO BE BULLISH.

• • •

Missing some Tweet in this thread? You can try to force a refresh
 

Keep Current with TAnalyst

TAnalyst Profile picture

Stay in touch and get notified when new unrolls are available from this author!

Read all threads

This Thread may be Removed Anytime!

PDF

Twitter may remove this content at anytime! Save it as PDF for later use!

Try unrolling a thread yourself!

how to unroll video
  1. Follow @ThreadReaderApp to mention us!

  2. From a Twitter thread mention us with a keyword "unroll"
@threadreaderapp unroll

Practice here first or read more on our help page!

More from @AurelienOhayon

Apr 27
1/ To the XOR Members, my Trading Robot Company :

Dear XOR Members,

Our phase indicator is always on "cut", as it detects instability and high degree of risk in the short term.
2/ On the other hand, we remain very confident in our medium-term analysis : we do not see any capitulation below the zone identified as historical bottom by our indicators and macro analysis : 33K seems to be the bottom 2022.
3/ The macro structure of #BTC is composed of HH and HL (Higher Highs and Higher Lows), which is by definition bullish on the medium-long term.

Historically, no market capitulation has occurred at the end of an HH-HL structure.
Read 5 tweets
Apr 16
1/ In this thread we show how S&P500 indicators have accurately determined the set of #Bitcoin bottoms throughout its history.

There is no certainty in trading, but the odds that this right detection continuing is over 80%.

This work shows that the last #BTC bottom is recent.
2/ The Standard and Poor's 500 (S&P 500), $SPX, is a stock market index tracking the performance of 500 large companies listed on stock exchanges in the United States.

It is one of the most commonly followed equity indices.

Market cap : US$42.4 trillion.
3/ BTC's bottoms detection using the 2W-Stochastic RSI K-line of the S&P500.
Read 13 tweets
Apr 14
#BITCOIN For the 3rd time since 2015, we have reached the green zone.

The last 2 times this occured, a massive bullish uptrend followed.

Probably nothing...
#BTC #Crypto
The Choppiness Index is a volatility indicator that can be used to determine if a market is trending or range.

The numbers range from 0 to 100, with low numbers indicating a strong trend and high numbers signifying consolidation.
Read 4 tweets
Apr 12
1/ In this thread, we look at a number of confluent indicators that, when combined, suggest that the 2022 bottom has already been reached.

Each chart is clear enough to be self-explanatory.

We studied 25 indicators. Image
2/ Williams %R Indicator, 3W timeframe. Image
3/ Supertrend Indicator, Technical Ratings indicator, Monthly timeframe. Image
Read 23 tweets

Did Thread Reader help you today?

Support us! We are indie developers!


This site is made by just two indie developers on a laptop doing marketing, support and development! Read more about the story.

Become a Premium Member ($3/month or $30/year) and get exclusive features!

Become Premium

Don't want to be a Premium member but still want to support us?

Make a small donation by buying us coffee ($5) or help with server cost ($10)

Donate via Paypal

Or Donate anonymously using crypto!

Ethereum

0xfe58350B80634f60Fa6Dc149a72b4DFbc17D341E copy

Bitcoin

3ATGMxNzCUFzxpMCHL5sWSt4DVtS8UqXpi copy

Thank you for your support!

Follow Us on Twitter!

:(