I'm back from my week not posting, and here's my forecast for the #inflation numbers on Wednesday 5/11
I forecast the #CPI headline to be 8.2% year-over-year, down from 8.6% YoY in March
Month-over-Month that's 0.35%, down from 1.24%
Core CPI I predict 5.6% YoY, down from 6.2%
I forecast the #CPI headline to be 8.2% year-over-year, down from 8.6% YoY in March
Month-over-Month that's 0.35%, down from 1.24%
Core CPI I predict 5.6% YoY, down from 6.2%

This reading should give the fed some hope that inflation is dying down, but we've also heard that before, if I'm right with my call of 0.35% for April, the red line is where the trailing 6 month inflation would be
We've had pauses on this journey before, so can't trust 1 month
We've had pauses on this journey before, so can't trust 1 month

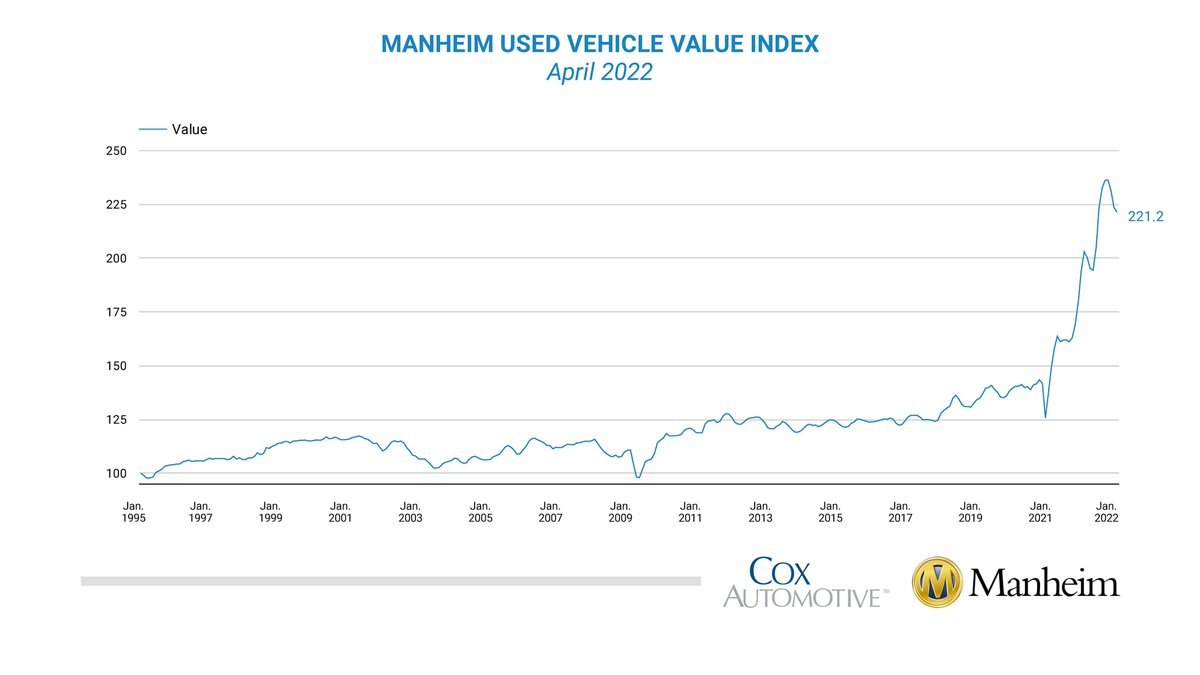
Nearly the entire decline this month is caused by a decline in used car prices. The transitorians cited used cars all last year to explain away inflation
Curious to see if they cite it to discount the slowdown in #inflation as well, I wouldn't hold you breath on that one though
Curious to see if they cite it to discount the slowdown in #inflation as well, I wouldn't hold you breath on that one though
With markets oversold and the economy looking increasingly weak (likely in recession), its very possible this big deceleration in the monthly inflation figures will cause a pump across markets broadly
Be sure to comment with your own predictions for Wednesday's CPI number!
Be sure to comment with your own predictions for Wednesday's CPI number!
Also it’s important to note that CPI has increasingly become detached from reality
To get my forecast I have to incorporate a trend of it being increasingly separated from real world measures, especially on rents
To get my forecast I have to incorporate a trend of it being increasingly separated from real world measures, especially on rents
It’s likely it will never catch up, @BLS_gov is unfortunately causing a permanent decline in the standard of living for all of society through CPI distortion
Especially seniors and those who receive CPI adjusted benefits
Especially seniors and those who receive CPI adjusted benefits
• • •
Missing some Tweet in this thread? You can try to
force a refresh