1/12
Did you try predicting momentum in stock but failed? This thread is for you.
In this tread, we will discuss the concept of Momentum Trading using Relative Strength to identify a perfect trade setup which will have high accuracy and small SL.
Strategy Thread 🧵⬇️
Did you try predicting momentum in stock but failed? This thread is for you.
In this tread, we will discuss the concept of Momentum Trading using Relative Strength to identify a perfect trade setup which will have high accuracy and small SL.
Strategy Thread 🧵⬇️
2/12
Relative Strength is a behaviour of stock w.r.t Benchmark or Sector. That means it is a method of identifying stocks or instruments that are relatively strong or weak either against benchmark or sector.
Relative Strength is a behaviour of stock w.r.t Benchmark or Sector. That means it is a method of identifying stocks or instruments that are relatively strong or weak either against benchmark or sector.
3/12
If you are following me for some time now, you know what is momentum.
If not, check out my Twitter Thread on RSI
If you are following me for some time now, you know what is momentum.
If not, check out my Twitter Thread on RSI
https://twitter.com/kaushikaki/status/1467134735117922309?s=20
4/12
Let us understand the setup
- For Bullish, relatively strong stock in strong bullish momentum
- For Bearish, relatively weak stocks in strong bearish momentum
The concept of strong momentum is explained in the RSI Twitter Thread and YT video:
Let us understand the setup
- For Bullish, relatively strong stock in strong bullish momentum
- For Bearish, relatively weak stocks in strong bearish momentum
The concept of strong momentum is explained in the RSI Twitter Thread and YT video:
5/12
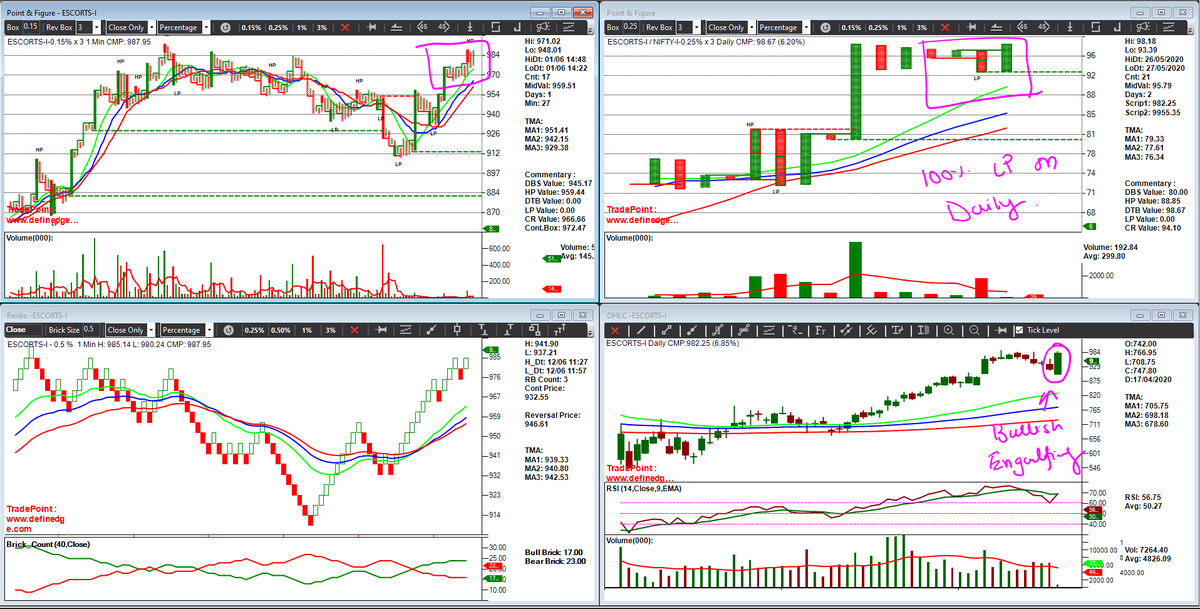
Bullish Trade Setup
Conditions:
1. Relatively Strong Stocks against Benchmark and Sector for a period of both 1 Week and 3 Months
2. RSI above 70
Software Credit: @mystockedge
Bullish Trade Setup
Conditions:
1. Relatively Strong Stocks against Benchmark and Sector for a period of both 1 Week and 3 Months
2. RSI above 70
Software Credit: @mystockedge

6/12
Bearish Trade Setup
Conditions:
1. Relatively Weak Stocks against Benchmark and Sector for a period of both 1 Week and 3 Months
2. RSI Below 30
Software Credit: @mystockedge
Bearish Trade Setup
Conditions:
1. Relatively Weak Stocks against Benchmark and Sector for a period of both 1 Week and 3 Months
2. RSI Below 30
Software Credit: @mystockedge

7/12
Creating Scanner using @mystockedge
Step-1) Go --> My StockEdge
Step-2) Click --> My Combo Scan
Step-3) Create a Scan
Step-4) Create Bullish Scan
Step-5) Create Bearish Scan
Creating Scanner using @mystockedge
Step-1) Go --> My StockEdge
Step-2) Click --> My Combo Scan
Step-3) Create a Scan
Step-4) Create Bullish Scan
Step-5) Create Bearish Scan


9/12
Bullish Trade Example
As the current market cycle was bearish, I did not get enough examples. But found few upcoming trades. This will put my strategy to test
Let us evaluate the strategy together
1. #TVSMotors
2. #DRREDDY
Bullish Trade Example
As the current market cycle was bearish, I did not get enough examples. But found few upcoming trades. This will put my strategy to test
Let us evaluate the strategy together
1. #TVSMotors
2. #DRREDDY


10/12
Credits:
I learnt the concept of Relative Strength from two stalwarts of financial markets:
@Prashantshah267 from his book 'Outperforming The Markets using Relative Strength'
@vivbajaj, having the privilege of working with him and discussing markets on a regular basis.
Credits:
I learnt the concept of Relative Strength from two stalwarts of financial markets:
@Prashantshah267 from his book 'Outperforming The Markets using Relative Strength'
@vivbajaj, having the privilege of working with him and discussing markets on a regular basis.
11/12
If this thread helped you, please re-tweet the first tweet and help others in their learning curve. This will also help me to reach a larger audience.
If this thread helped you, please re-tweet the first tweet and help others in their learning curve. This will also help me to reach a larger audience.
12/12
If you like my content, follow me at @kaushikaki
Subscribe to my YT channel: youtube.com/c/TheNoiseless…
Join the telegram channel: t.me/thenoiselesstr…
If you like my content, follow me at @kaushikaki
Subscribe to my YT channel: youtube.com/c/TheNoiseless…
Join the telegram channel: t.me/thenoiselesstr…
• • •
Missing some Tweet in this thread? You can try to
force a refresh