Ok, so we've had a relief bounce, and a lot of #altcoin's have had some really nice gains. But, let's be realistic. #Bitcoin#BTC $BTC
π§΅π
$BTC still can't even get over the 8EMA on the daily chart. Higher time frames are always king.
$ETH, the king of the #altcoin's, has managed to get over the 8EMA, but is already wanting to retest it. You can also see what has happened in all of it's previous attempts to get over this moving average.
$SOL is very close to crossing the 8/21 on the daily, but it's not there yet, and there's confluence down here near the EMA's themselves. No confirmation yet.
Be careful, don't listen to CT and influencers who tell you to buy just because they have a lot of followers. It's not an indicator that can be relied upon. I hope some of you have realized this already. Stop listening to people in chats, and start listening to charts. π―
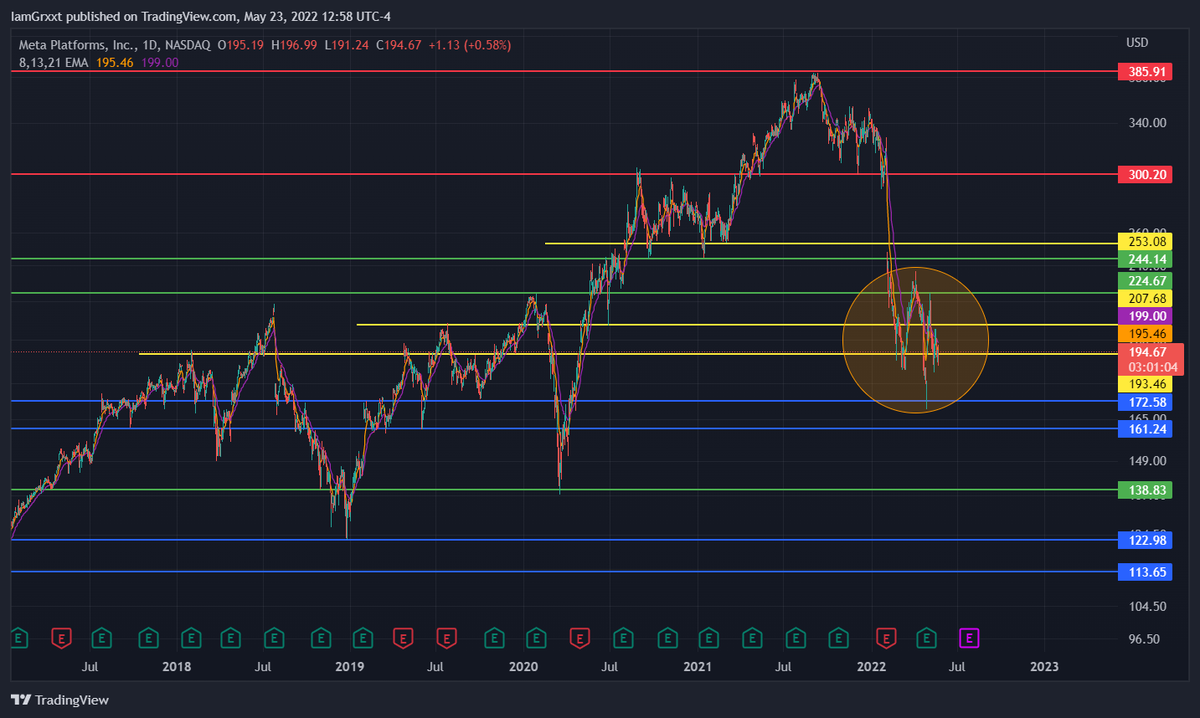
It's getting interesting. Looks like it wants to break out to the upside here. I'd love to see this happen and head towards the 21EMA(purple).
FYI: I don't like being a bear. I so badly want to be a bull again. π
β’ β’ β’
Missing some Tweet in this thread? You can try to
force a refresh
Whether you're aπor aπ», everyone should have their own set of rules to follow. You're trading plan is your guide to success. Here are 7 tips I've learned to live by, and you should too. #Bitcoin#SPY#ETH#Crypto
π§΅π
1. Establish a plan!π―
Plan your trades carefully before you enter a position. This means having the price you want to enter, a stop loss, and a take profit zone BEFORE you enter a position. If you aren't doing this, you're probably losing money.πΈ
2. Protect your capital!πͺ
Cut losses quickly. Don't hold and hope, it will 9/10 create bigger losses. If you're plan says to cut at 5% loss, cut it without exceptions, EVERYTIME!
Here's a chart that shows what it would take to recover funds at certain levels of loss.
Here's our weekly look ahead: $ES has a good chance to reach $4000 again this week. After that it will need to hold above this downtrend for continuance.
$NQ has just peaked above the downtrend in this falling wedge pattern. Watch to see if it gets above and holds this week. If it can't expect a retrace back down to at least the middle line.
$BTC is still fighting the daily 8EMA. Rolling over slightly. Not a good look honestly. #Bitcoin
$SPY We had a bullish 8/21 cross for a little while, but straight back down to bearish territory again today. With CPI data releasing at 8:30am EST tomorrow. The chart is telling us in advance what we can possibly expect.
Bearish MACD, RSI, 8/21, under Pivot. Not a good look.
$NQ in the same boat. I imagine crypto may suffer the same fate soon.
Let's take a look.
Under pivot, 8/21 bearish, rejected 0.5 above. There's literally NOTHING tech related I would buy right now.
Here's a side-by-side of $SPX and $BTC since the March 2020 crash. Turns out it wasn't a crash, but just the dip before the rip! Now, what can we say? Well, mostly that people are taking profits after a massive increase taking advantage of retail traders like you and I.
π§΅π
I know a lot of people who are hurting. They just started investing for the first time recently. Most likely baited by the media, crypto Twitter price targets, or friends who showed them their huge gains. They just bought on word of mouth without doing any research.
What can we do now? Well there are two options:
1. Give up. You tried, it's too much and you don't feel like it's worth it to continue. Big money wins. You lose.
2. You can start learning, doing your own research, and make your own decisions based on technical analysis.
Short term falling wedge. Potentially bullish set up with bullish divergence. $ETH
I've entered long on this with a stop just below the wedge. Let's see how it plays out. Short term price target is $1,940. Stop loss at $1,680. Entry is $1,730. I'm risking $50 to win $210. That's a 4:1+ R/R. Can this trade lose? Yes, but it's a calculated risk I'm taking.
So now that I've got the move I wanted, I'll move my stop to entry, go to sleep risk free, and hope we get the break out.
I'll use Facebook(FB) stock for this example. Starting with a blank chart, on a high timeframe like the daily or weekly. I'm starting with the weekly because it offers more information to start. $FB
π§΅π
Look for the places where the price reacted more than once in the same location. The goal is to try and get as many candle touches on the line as possible. I like to mark areas of resistance in red(above current price), and support in blue(below current price).
Now zoom into a lower timeframe(daily) and adjust the lines to hit more candles. The green lines are previous lines I adjusted slightly, and the yellow lines are new ones I've found. Now that we have these, I'll zoom into a 4hr chart to see this circled area better.