Why $BRK's 2019-20 purchase of #Japan Inc is a potential #stagflation trade for the history books
🧵 follows
In this week’s PBL (just out!) we PiggyBack:
Warren Buffett’s Berkshire Hathaway into Japanese trading houses
Read/join free @SubstackInc:
piggyback.one/p/buffetts-inf…
1/X
🧵 follows
In this week’s PBL (just out!) we PiggyBack:
Warren Buffett’s Berkshire Hathaway into Japanese trading houses
Read/join free @SubstackInc:
piggyback.one/p/buffetts-inf…
1/X
Let's get to it:
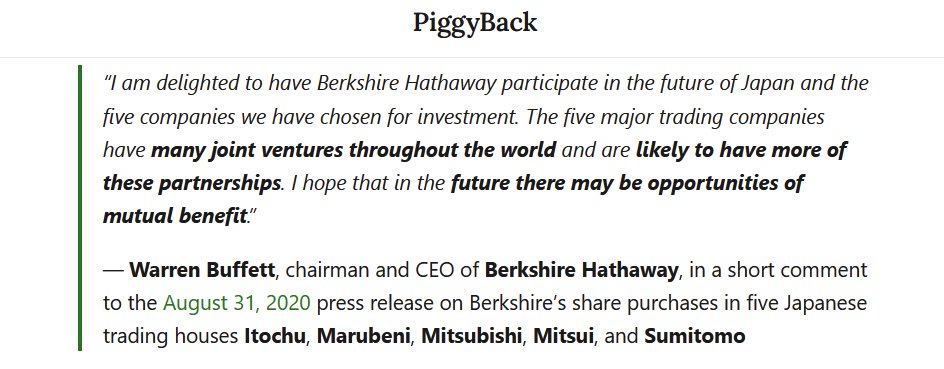
August 31, 2020. $BRK sent out a release that left its many U.S.-focused watchers curious:
Berkshire disclosed having 5+% stakes in all five of #Japan's "big five" general trading houses (Sogo Shosha) after purchasing over 12 months in Tokyo Stock Exchange
2/X
August 31, 2020. $BRK sent out a release that left its many U.S.-focused watchers curious:
Berkshire disclosed having 5+% stakes in all five of #Japan's "big five" general trading houses (Sogo Shosha) after purchasing over 12 months in Tokyo Stock Exchange
2/X

Buffett's / $BRK's "big five"
1 Itochu 🇯🇵TYO:8001|🇺🇸 $ITOCY
2 Marubeni Corp 🇯🇵TYO:8002|🇺🇸 $MARUY
3 Mitsubishi Corp 🇯🇵TYO:8058|🇺🇸 $MTSUY
4 Mitsui & Co 🇯🇵TYO:8031, 🇺🇸 $MITSY
5 Sumitomo Corp 🇯🇵TYO:8053|🇺🇸 $SSUMY
Chart @theTIKR
Disclosure: Long 1+2+3+4+5 piggyback.one/p/legal-discla…
3/X
1 Itochu 🇯🇵TYO:8001|🇺🇸 $ITOCY
2 Marubeni Corp 🇯🇵TYO:8002|🇺🇸 $MARUY
3 Mitsubishi Corp 🇯🇵TYO:8058|🇺🇸 $MTSUY
4 Mitsui & Co 🇯🇵TYO:8031, 🇺🇸 $MITSY
5 Sumitomo Corp 🇯🇵TYO:8053|🇺🇸 $SSUMY
Chart @theTIKR
Disclosure: Long 1+2+3+4+5 piggyback.one/p/legal-discla…
3/X

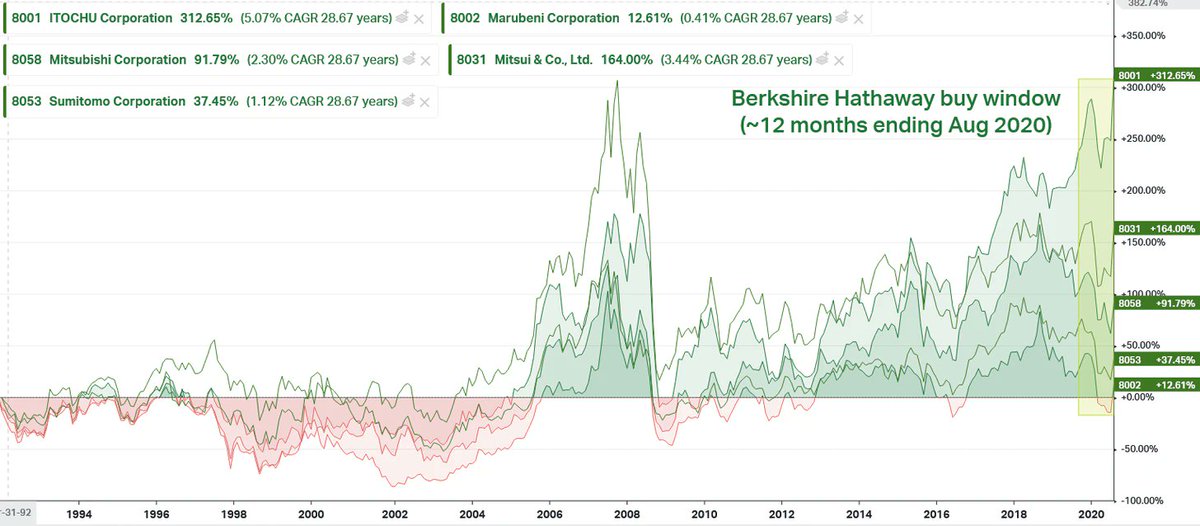
From 1992, following the slow depletion of Japan's 80s bubble, these Sogo Shosha stocks produced a mere 3% per year in mean/median annual total returns (CAGR, JPY) up until $BRK:s disclosure.
But, as we say in #valueinvesting "price is what you pay"...
Chart: @KoyfinCharts
4/X
But, as we say in #valueinvesting "price is what you pay"...
Chart: @KoyfinCharts
4/X

Now securities returns and fundamentals can be very different, even over decades.
As businesses, $BRK's Japanese trading houses are very exposed to the physical trading of #commodities and goods. They are cyclical.
Notice how the ROE% follows commodities?
Chart: @theTIKR
5/X
As businesses, $BRK's Japanese trading houses are very exposed to the physical trading of #commodities and goods. They are cyclical.
Notice how the ROE% follows commodities?
Chart: @theTIKR
5/X

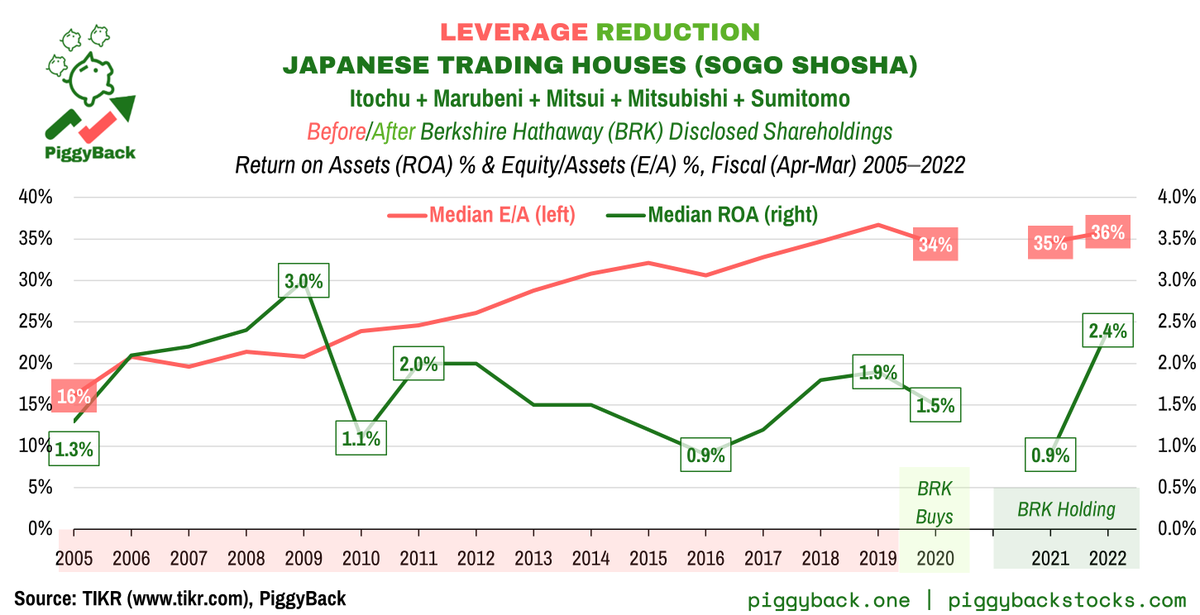
Under the hood of ROE, a promising trend is that the trading houses have deleveraged. From 16% median Equity/Assets in 2005 to 34% 2020
Why? A shift of focus
From: asset-intensive/high competition/lower margin trading
To: higher-return/higher-risk investing
Chart: @theTIKR
6/X
Why? A shift of focus
From: asset-intensive/high competition/lower margin trading
To: higher-return/higher-risk investing
Chart: @theTIKR
6/X

The underlying value Berkshire got seems OK/possibly improving.
What about the price $BRK paid?
Not surprising to #valueinvesting community, Buffett can still wait for opportunistic discounts 🎣
Sogo Shoshas got there after 2010s commodities bear market 📉
Chart @theTIKR
7/X
What about the price $BRK paid?
Not surprising to #valueinvesting community, Buffett can still wait for opportunistic discounts 🎣
Sogo Shoshas got there after 2010s commodities bear market 📉
Chart @theTIKR
7/X

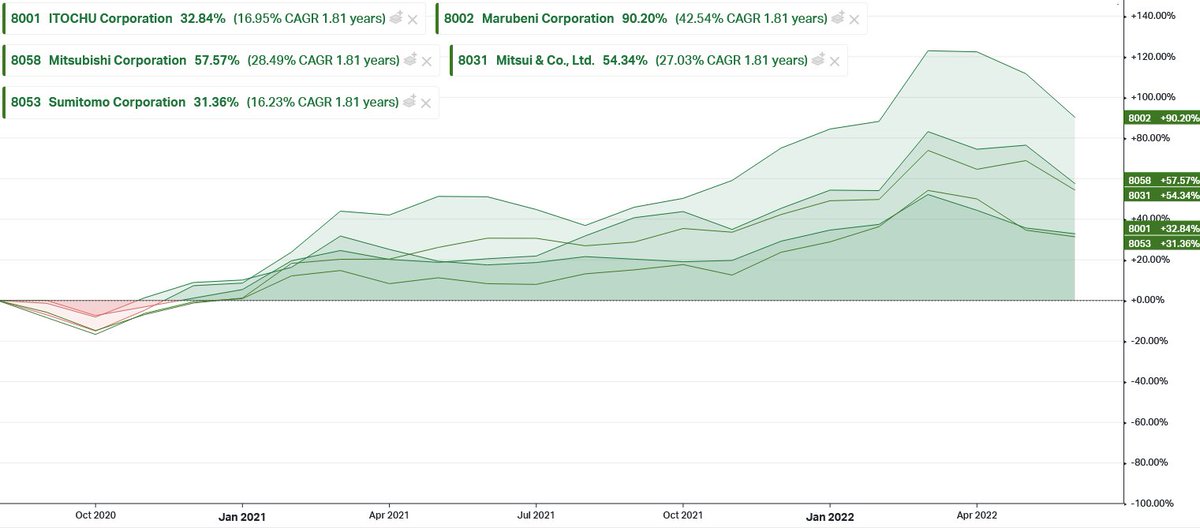
How has #Buffett & Co done 1 year + 10 months after $BRK's disclosure?
Returns: Not bad, >25% median&mean annual total returns (CAGR). Chart: @KoyfinCharts
Fundamentals: Trading houses benefit from pandemic supply constraints + commodities inflation
Valuation: Chart above
8/X
Returns: Not bad, >25% median&mean annual total returns (CAGR). Chart: @KoyfinCharts
Fundamentals: Trading houses benefit from pandemic supply constraints + commodities inflation
Valuation: Chart above
8/X

Our takeaways after "piggybacking" Buffett & Berkshire to Japan?
...
piggyback.one/i/60642782/pig…
Summary of
“Buffett's Inflation Bet With The House(s)”
Issue 3 of new, 100% independent PiggyBack Letter @SubstackInc
1) 💡?
2) #valueinvesting?🧮
3) Free?🫰
Join:🚪🐖!
Share:📣🐖!
X/X
...
piggyback.one/i/60642782/pig…
Summary of
“Buffett's Inflation Bet With The House(s)”
Issue 3 of new, 100% independent PiggyBack Letter @SubstackInc
1) 💡?
2) #valueinvesting?🧮
3) Free?🫰
Join:🚪🐖!
Share:📣🐖!
X/X

• • •
Missing some Tweet in this thread? You can try to
force a refresh


