QF Research Profile picture
Jun 28 4 tweets 3 min read
1) People intending to vacation by car fell to 22.7% in June (BN).

Lowest seasonally in > 4Y.

"36% of Americans surveyed this month intend to take a vacation within the next six months, the weakest June reading any ...

$SPY $QQQ $TLT $GLD #Commodities
bloomberg.com/news/articles/… Image
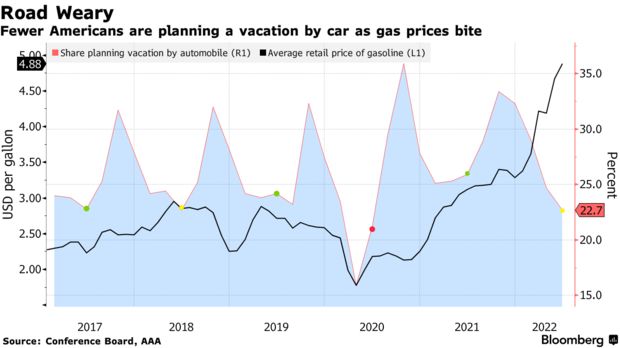
2) Y in data going back over 40 years, excluding 2020"

So at least some demand destruction may continue.

Avg US unleaded price was $4.88 yesterday vs $5.02 peak Jun 13.

But gas price spiked end of May into Jun. So avg Jun price MTD is $4.96 vs $4.56 ...
3) avg in May (+ big M/M), which is one of the reasons why Cleveland M/M headline #CPI nowcast is still very high.

Gas price likely falls more, but even if price stops falling, avg price will be down M/M in Jul and becomes a NEGATIVE headwind to Jul CPI!
4) Btw energy is modeled fairly accurately. Whether headline/core CPI is above/below consensus depends on all other components.

Given cyclical, commodity, demand, inventory dynamics discussed in various threads, remain confident core CPI peaked in Mar.

• • •

Missing some Tweet in this thread? You can try to force a refresh
 

Keep Current with QF Research

QF Research Profile picture

Stay in touch and get notified when new unrolls are available from this author!

Read all threads

This Thread may be Removed Anytime!

PDF

Twitter may remove this content at anytime! Save it as PDF for later use!

Try unrolling a thread yourself!

how to unroll video
  1. Follow @ThreadReaderApp to mention us!

  2. From a Twitter thread mention us with a keyword "unroll"
@threadreaderapp unroll

Practice here first or read more on our help page!

More from @ResearchQf

Jun 30
1) South Korea's chip stockpiles increased by most in more than four years (BN).

The Y/Y spike in chip inventory in '18 was followed by a cyclical downturn. Excesses are bigger this cycle.

This is inventory just at ...

$SPY $QQQ $TLT $GLD #Commodities
bloomberg.com/news/articles/… Image
2) manufacturers of chips.

Their customers, customers of customers etc also have too much inv (PC, smartphone, assemblers, contract manufacturers, retailers etc) and are cutting orders precisely when chip manufacturers have too much inv.

What shortages?

Undershipment has ...
3) to follow when inventory is too high, lead times fall, shortages end.

CEO: why do we have so much inv when we can (order) parts tomorrow?

Orders fall => backlog falls => shipments fall => overcapacity => prices fall => inv dumping => even lower ...
Read 7 tweets
Jun 29
1) One more. Richmond #Fed manufacturing survey lead time lowest since '19.

Don't forget these are diffusion indices so ~ rate of change vs absolute levels but a cliff both ways.

Orders, shipments, lead times etc ...

$SPY $QQQ $TLT $GLD #Commodities
Image
2) sound familiar? That huge inventory stocking cycle now likely morphing into huge destocking cycle.

"I.e. no shortages? Downturn inevitable if preceded by inventory overbuild.

CEO: why do we have so much inventory when we can (order) parts tomorrow?"
Image
3) I used semis (where retail inventory is the tip of bullwhip) to illustrate this cycle given semis are super cyclical and important to so many sectors of economy.

Reversal of super high beta cycle seems to be supported with almost every new fundamental or economic data point.
Read 5 tweets
Jun 27
1) Seeing many versions of #gold vs real #yield lately.

Here's 1Y corr between gold and 10Y real yield.

Yes more neg last decade or so. But corr only hit same level late '00 and '05 as yields were rising. Just before bull market began and ...

$SPY $QQQ $TLT $GLD #Commodities Image
2) as bull market accelerated late '05. Corr was also as high Aug '12 (but with gold and yield falling). Even then there was a ST rally.

But 24Y may be too short given possible regime changes.

Let's look at 1Y corr between gold/nominal 10Y rate since '75. Not perfect but ... Image
3) nominal rates usually rise with real rates (so periods of high corr with gold are similar for nominal and real rates).

Corr with nominal was as high Jan '78 and Nov '79. Aug '76 didn't hit threshold but it was close.

Data doesn't cover '73-'74 but very high corr in '75 ...
Read 5 tweets
Oct 5, 2021
1) % of $XAU stocks > their 200D MAs has been 0% 10D in a row (went to 3% for 2D after this tweet). $GDX $GDXJ

So 10D MA of % of XAU stocks > 200D MA is also 0%.

Here are the days since '02 when this first occurred ...

$SPY $QQQ $TLT $GLD #Commodities
2) (or came very very close).

9/17/18 (0% 10D MA)
8/5/15 (1%)
11/10/14 (0%)
3/5/13 (0%)
5/16/12 (0%)
10/29/08 (0%)
5/24/05 (2%)
5/18/04 (0%)

Every date not far from a major IT or LT low with that BIG exception in '13 (see posts about '13 last 6M).

10D stayed at 0% in '13 ...
3) for 5M and XAU fell 36% more before an IT low.

Besides '13 the low was usually a few days before these dates.

Different info in 10D charts. Fidelity is lost. E.g. Mar '20 doesn't show as selloff was so sharp.

Doesn't hurt GDXJ up > 1% while GLD down > 0.4% today. That's ...
Read 8 tweets
Feb 10, 2021
1) When I read articles about $gold or $silver, I begin a skeptic. Ronan Manly may be the most analytical person in the sector, but I don't know that (yet), and there is so much misinformation about this group.

The good news ...

$SPY $QQQ $GLD $SLV $GDX
bullionstar.com/blogs/ronan-ma…
2) is that a quick Bloomberg back-of-the-envelope seems consistent with his broad conclusion.

As best as I can tell, his 28K tonne of ETF silver in London is less than total ETF holdings mostly because 1/7 SLV vaults is in NY and $PSLV is in Canada.

Taking a step back, ETF ...
3) holdings of silver rose sharply while silver in London declined for months into July 2020. The delta between the two was by far the lowest in its history.

Silver then began a sharp run on 7/20/20 (dashed line), rising 50% in a few weeks.

It's hard to decouple macro, but ...
Read 5 tweets
Feb 5, 2021
FT - $Silver surge could signal coming commodities boom. Serious mainstream press.

FT yesterday - "Food inflation concerns deepen as prices reach highest level since 2014."

Bloomberg Commodity Index BCOM goes back to 1960.

$SPY $QQQ #Commodities #Gold
ft.com/content/faef0b…
2) Sure like a 12Y downtrend reversed in December.

Agricultural commodities also did so on a linear chart in Dec. $DBA continues chugging along and has even more upside on a log chart if this is real.

Back to silver. Did silver break out vs. BCOM ...
3) (which also tells you how atrocious commodities broadly have been for so long)?

At least on this chart, the run from 20 to 30 last summer happened after ratio broke the old high. Maybe we're just retesting that point with silver correcting & other commodities rising?
Read 7 tweets

Did Thread Reader help you today?

Support us! We are indie developers!


This site is made by just two indie developers on a laptop doing marketing, support and development! Read more about the story.

Become a Premium Member ($3/month or $30/year) and get exclusive features!

Become Premium

Don't want to be a Premium member but still want to support us?

Make a small donation by buying us coffee ($5) or help with server cost ($10)

Donate via Paypal

Or Donate anonymously using crypto!

Ethereum

0xfe58350B80634f60Fa6Dc149a72b4DFbc17D341E copy

Bitcoin

3ATGMxNzCUFzxpMCHL5sWSt4DVtS8UqXpi copy

Thank you for your support!

Follow Us on Twitter!

:(