QF Research Profile picture
Jul 1 5 tweets 3 min read
1) #Fed funds futures update.

Pricing only 0.78 hikes over 2 meetings (Dec '22/Feb '23). So basically 100% chance of Dec or Feb pause and ~20% chance of 0 hikes after Nov.

Implied Dec rate 3.31% vs 3.78% peak few W ago.

$SPY $QQQ $TLT $GLD #Commodities
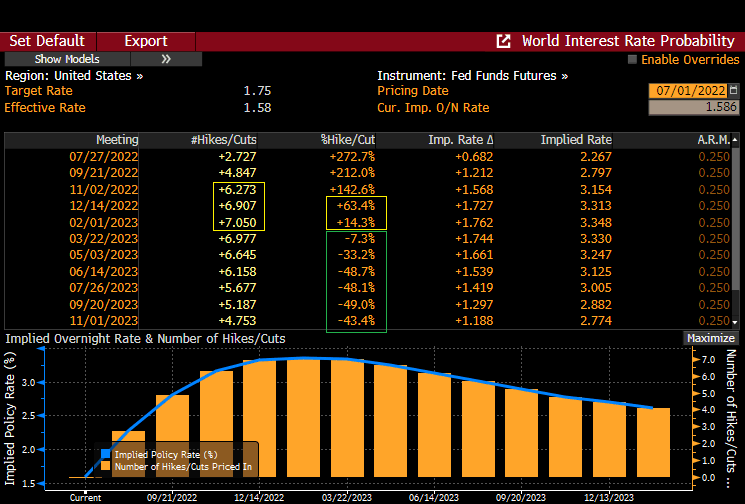
2) Notice small prob of a cut in Mar and significant prob of cuts every meeting thereafter?

What happens if ISM < 50 within few M (fed hasn't hiked with ISM < 50 since 70's)?

OIS 2Y-1M #yield spread 6M forward (1M is decent proxy for overnight rate) ...
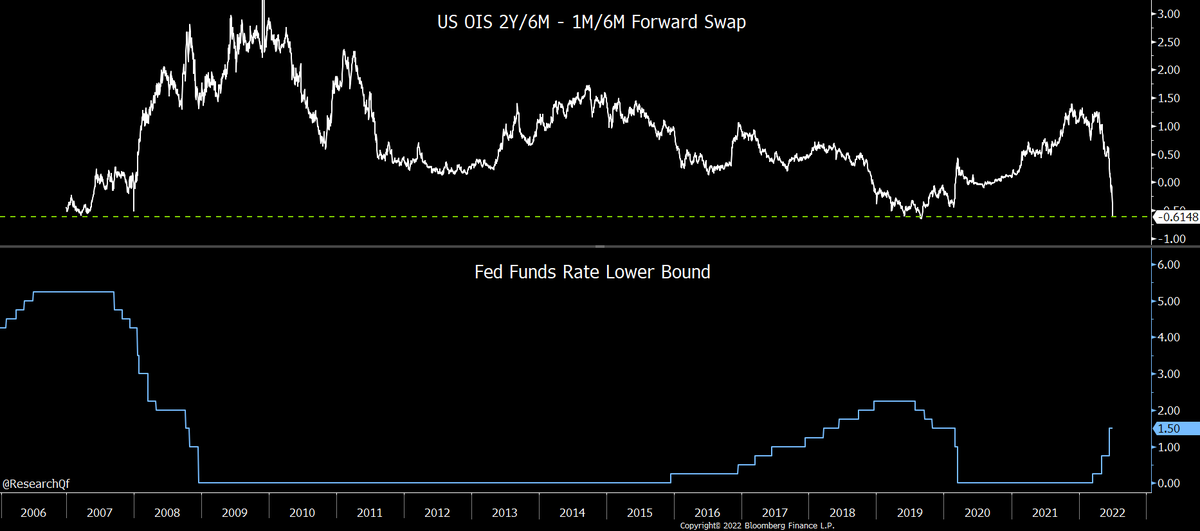
3) inverted 61 bps. Using OIS swaps which are more accurate vs Treasuries (Btw how was 1M Treasury yielding 60 bp less than overnight rate last W? You get the idea).

Give this thought. Market is pricing 2Y yield ~60 bps LOWER than Fed funds rate 6M from now!

Fed paused when ...
4) OIS 2Y-1M 6M forward was less inverted last 2 cycles.

And a cut followed when inversion hit similar level in '07 and '19.

Fed clearly not cutting in Jul. But it does signal rising risk of another big policy error.

High frequency fundamental and ...
5) economic data will remain super important next few months.

Depending on near term data, that ~35% chance of pause in Dec will easily become large with only 10-15 bps changes in implied Fed funds rates. And also easily morph into a tangible chance of a pause in Nov.

• • •

Missing some Tweet in this thread? You can try to force a refresh
 

Keep Current with QF Research

QF Research Profile picture

Stay in touch and get notified when new unrolls are available from this author!

Read all threads

This Thread may be Removed Anytime!

PDF

Twitter may remove this content at anytime! Save it as PDF for later use!

Try unrolling a thread yourself!

how to unroll video
  1. Follow @ThreadReaderApp to mention us!

  2. From a Twitter thread mention us with a keyword "unroll"
@threadreaderapp unroll

Practice here first or read more on our help page!

More from @ResearchQf

Jul 2
1) $GLD down a bit but $GDX $GDXJ strong Fri.

Many backtests with various conditions/timeframes improves at least ST risk/reward (i.e. not guarantee).

Even in May there was a ST rally.

And $SLV < -1.5% but $SIL > +2%?

$SPY $QQQ $TLT #Gold #Commodities
Image
2) Also looks bullish tho N=only 3 since ‘10.

Given how oversold/multiple indicators showing signs of capitulation, prob better to have these than not.

As @TheDailyGold mentioned, % of $HUI stocks above 200D MAs was 0% Thur.

Besides ‘13 very low % …
thedailygold.com/gold-stocks-ar…
3) of HUI components above 200D MAs was IT/LT bullish.

Posted these Mar ‘21 and Sep ‘21 when % was < 5.

And only other day at 0% last 5Y was 3/13/20.

Didn’t expect new 52W lows in HUI given pinned post.

There was a big bounce after 3/16/22. But max …
Read 5 tweets
Jun 30
1) South Korea's chip stockpiles increased by most in more than four years (BN).

The Y/Y spike in chip inventory in '18 was followed by a cyclical downturn. Excesses are bigger this cycle.

This is inventory just at ...

$SPY $QQQ $TLT $GLD #Commodities
bloomberg.com/news/articles/… Image
2) manufacturers of chips.

Their customers, customers of customers etc also have too much inv (PC, smartphone, assemblers, contract manufacturers, retailers etc) and are cutting orders precisely when chip manufacturers have too much inv.

What shortages?

Undershipment has ...
3) to follow when inventory is too high, lead times fall, shortages end.

CEO: why do we have so much inv when we can (order) parts tomorrow?

Orders fall => backlog falls => shipments fall => overcapacity => prices fall => inv dumping => even lower ...
Read 7 tweets
Jun 29
1) One more. Richmond #Fed manufacturing survey lead time lowest since '19.

Don't forget these are diffusion indices so ~ rate of change vs absolute levels but a cliff both ways.

Orders, shipments, lead times etc ...

$SPY $QQQ $TLT $GLD #Commodities
2) sound familiar? That huge inventory stocking cycle now likely morphing into huge destocking cycle.

"I.e. no shortages? Downturn inevitable if preceded by inventory overbuild.

CEO: why do we have so much inventory when we can (order) parts tomorrow?"
3) I used semis (where retail inventory is the tip of bullwhip) to illustrate this cycle given semis are super cyclical and important to so many sectors of economy.

Reversal of super high beta cycle seems to be supported with almost every new fundamental or economic data point.
Read 5 tweets
Jun 28
1) People intending to vacation by car fell to 22.7% in June (BN).

Lowest seasonally in > 4Y.

"36% of Americans surveyed this month intend to take a vacation within the next six months, the weakest June reading any ...

$SPY $QQQ $TLT $GLD #Commodities
bloomberg.com/news/articles/… Image
2) Y in data going back over 40 years, excluding 2020"

So at least some demand destruction may continue.

Avg US unleaded price was $4.88 yesterday vs $5.02 peak Jun 13.

But gas price spiked end of May into Jun. So avg Jun price MTD is $4.96 vs $4.56 ...
3) avg in May (+ big M/M), which is one of the reasons why Cleveland M/M headline #CPI nowcast is still very high.

Gas price likely falls more, but even if price stops falling, avg price will be down M/M in Jul and becomes a NEGATIVE headwind to Jul CPI!
Read 4 tweets
Jun 27
1) Seeing many versions of #gold vs real #yield lately.

Here's 1Y corr between gold and 10Y real yield.

Yes more neg last decade or so. But corr only hit same level late '00 and '05 as yields were rising. Just before bull market began and ...

$SPY $QQQ $TLT $GLD #Commodities Image
2) as bull market accelerated late '05. Corr was also as high Aug '12 (but with gold and yield falling). Even then there was a ST rally.

But 24Y may be too short given possible regime changes.

Let's look at 1Y corr between gold/nominal 10Y rate since '75. Not perfect but ... Image
3) nominal rates usually rise with real rates (so periods of high corr with gold are similar for nominal and real rates).

Corr with nominal was as high Jan '78 and Nov '79. Aug '76 didn't hit threshold but it was close.

Data doesn't cover '73-'74 but very high corr in '75 ...
Read 5 tweets
Oct 5, 2021
1) % of $XAU stocks > their 200D MAs has been 0% 10D in a row (went to 3% for 2D after this tweet). $GDX $GDXJ

So 10D MA of % of XAU stocks > 200D MA is also 0%.

Here are the days since '02 when this first occurred ...

$SPY $QQQ $TLT $GLD #Commodities
2) (or came very very close).

9/17/18 (0% 10D MA)
8/5/15 (1%)
11/10/14 (0%)
3/5/13 (0%)
5/16/12 (0%)
10/29/08 (0%)
5/24/05 (2%)
5/18/04 (0%)

Every date not far from a major IT or LT low with that BIG exception in '13 (see posts about '13 last 6M).

10D stayed at 0% in '13 ...
3) for 5M and XAU fell 36% more before an IT low.

Besides '13 the low was usually a few days before these dates.

Different info in 10D charts. Fidelity is lost. E.g. Mar '20 doesn't show as selloff was so sharp.

Doesn't hurt GDXJ up > 1% while GLD down > 0.4% today. That's ...
Read 8 tweets

Did Thread Reader help you today?

Support us! We are indie developers!


This site is made by just two indie developers on a laptop doing marketing, support and development! Read more about the story.

Become a Premium Member ($3/month or $30/year) and get exclusive features!

Become Premium

Don't want to be a Premium member but still want to support us?

Make a small donation by buying us coffee ($5) or help with server cost ($10)

Donate via Paypal

Or Donate anonymously using crypto!

Ethereum

0xfe58350B80634f60Fa6Dc149a72b4DFbc17D341E copy

Bitcoin

3ATGMxNzCUFzxpMCHL5sWSt4DVtS8UqXpi copy

Thank you for your support!

Follow Us on Twitter!

:(